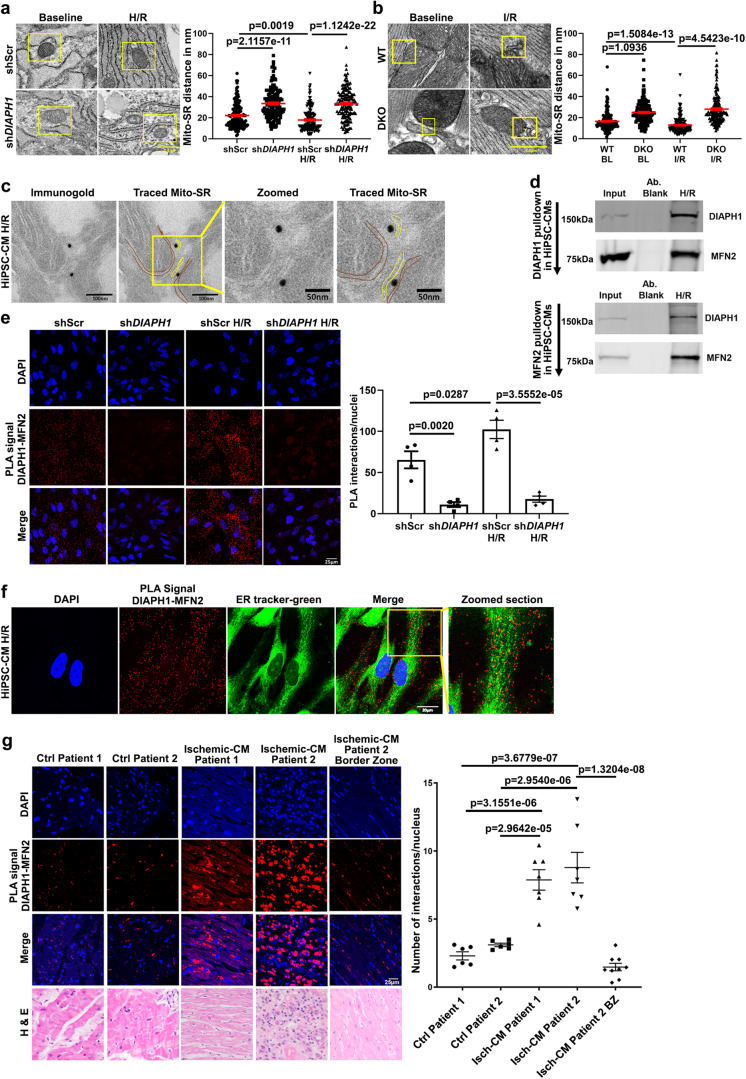
Fig. 1. DIAPH1 regulates Mitochondria(Mito)-SR/ER distance through interaction with MFN2.
TEM imaging was performed to measure Mito-SR/ER distance a shScr and shDIAPH1 hiPSC-CMs under normal and H/R conditions and b in perfused WT and DKO mice hearts under baseline or I/R conditions. The distance was measured using NIH ImageJ software. Scale bar 0.5 µm. (for a and b, Mito-SR/ER distance (in nm) from four biologically independent samples, Krushal–Wallis with Dunn’s pairwise comparison test was performed for p values) c Immuno-electron microscopy study showing DIAPH1 Immunogold particles located in close proximity with Mito and SR in HiPSC-CMs exposed to H/R. Scale bar 100 nm and 50 nm. d DIAPH1 and MFN2 pull-down assay in HiPSC-CMs exposed to H/R. Upper panel represents DIAPH1 pulldown followed by Western blot detection with MFN2 antibody and the lower panel represents MFN2 pulldown with DIAPH1 antibody detection. Input refers to the total lysate, Ab blank refers to IP sample without DIAPH1/MFN2 antibody e Leica SP8 Confocal microscopy images of fluorescent DUOLINK proximity ligation assay (PLA) signal of DIAPH1–MFN2. Interactions are represented as red dots and corresponding quantification was represented by number of positive interactions per nucleus in shScr and shDIAPH1 hiPSC-CMs under baseline and H/R. Scale bar 25 µm. f Leica SP8 confocal microscopy images of HiPSC-CMs under H/R stained with live staining ER-tracker green followed by co-staining with DUOLINK PLA red to detect SR–DIAPH1–MFN2 localization. Scale bar 20 µm. g DIAPH1-MFN2 DUOLINK PLA interactions in human heart biopsy sections (ischemic and non-ischemic) Scale bar 25 µm. The control samples were post-transplant endomyocardial biopsy and all other samples were sections of left ventricle from heart explants of patients with ischemic cardiomyopathy. Corresponding closest matched sections to DUOLINK for H&E staining was used to detect muscle morphology. Magnification for H&E sections were at 40×, 40×, 20×, 40×, and 20× respectively, in the order mentioned in the figure. For human biopsy samples, n represents random images taken from each tissue biopsy(for p values t-test with pooled SD was performed to compare between different patient biopsies. Unpaired t-test was performed between groups Isch-CM patient 2 vs. Isch-CM patient 2). Data are presented as the mean ± SEM. Statistics file and source data are provided as a Source Data file.

