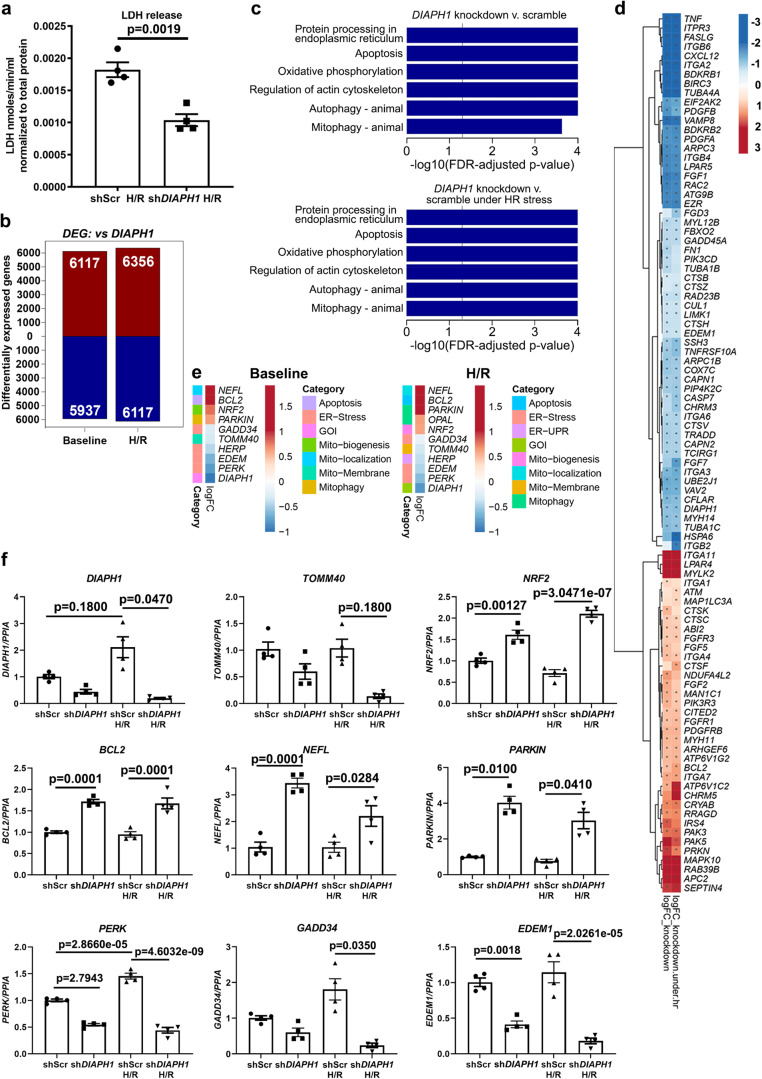
Fig. 3. Genomics data establish a link between DIAPH1 and Mito-SR/ER function.
a LDH release was measured in the supernatant of shDIAPH1 HiPSC-CMs compared to shScr HiPSC-CMs exposed to 30 min hypoxia and 60 min reoxygenation (H/R) to mimic ischemic injury (n represents four biologically independent samples, unpaired t-test was performed for p values). b Bulk RNAseq studies to show the total number of DEGs in shScr and shDIAPH1 HiPSC-CMs under baseline and H/R conditions. c KEGG pathway enrichment analysis was performed to show differentially regulated pathways, and d heat maps showing the top 50 up and downregulated genes related to mitochondria and SR/ER function (data obtained from four biologically independent samples). e Heat maps showing DEGs specific to mitochondria and SR/ER stress from more sensitive and targeted nCounter technology by NanoString (data obtained from four biologically independent samples). f qPCR validation of SR/ER stress and mitochondria markers confirmed by Bulk RNAseq and NanoString technology (n represents four biologically independent samples. Shapiro–Wilk test normality test was performed for all groups, following tests were performed for each gene respectively; Welch’s ANOVA with Games–Howell pairwise comparison Test for DIAPH1, GADD34, and PARKIN, Krushal–Wallis with Dunn’s pairwise comparison test for TOMM40 and ANOVA with TukeyHSD pairwise comparison for NRF2, BCL2, NEFL, PERK, and EDEM1). Data are presented as the mean ± SEM. Source data are provided as a Source Data file.

