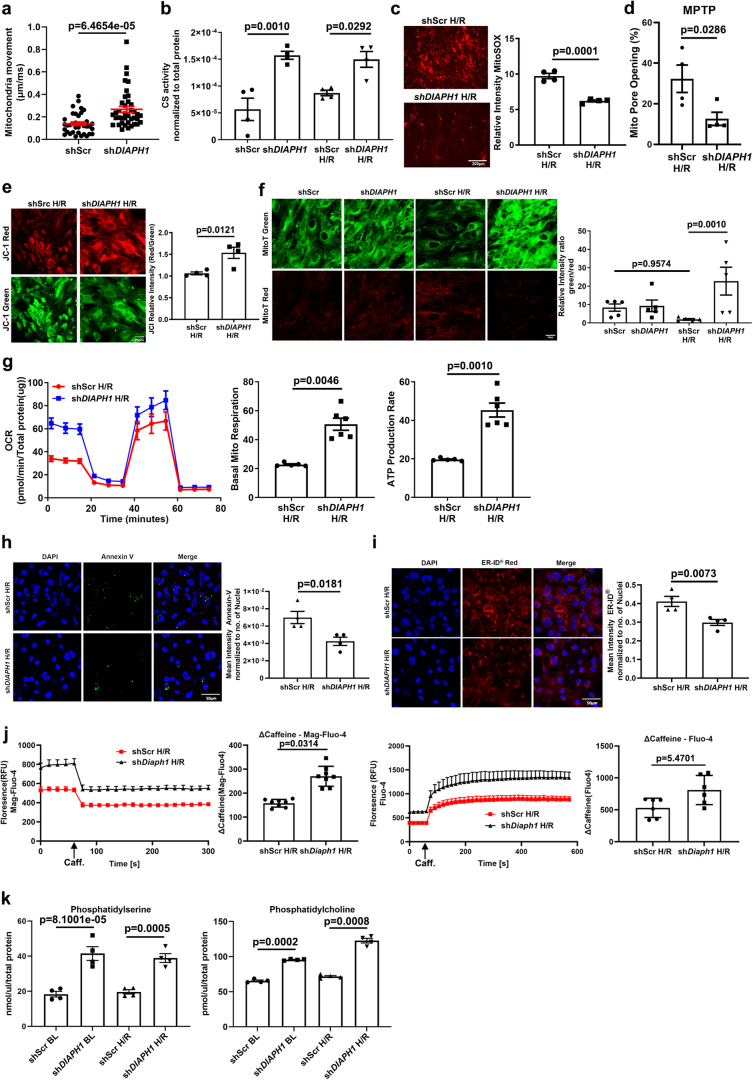
Fig. 4. Silencing DIAPH1 improves mitochondrial and ER function.
a Represents quantification of mitochondrial velocity (µm/ms) in shScr and shDIAPH1 hiPSC-CMs under baseline conditions. Nikon Eclipse Ti Epifluorescence Microscope (Inverted) at 40× magnification was used to obtain images of cells stained with MitoTracker™ Red CMXRos live cell imaging dye (each value represents velocity for individual mitochondria tracked, n = 5 biologically independent samples, p value obtained from Wilcoxon rank-sum test). b Colorimetric assessment of citrate synthase activity in HiPSC-CMs under Baseline and H/R (n = 4 biologically independent samples, p value obtained from ANOVA with TukeyHSD pairwise comparison test). c Mitochondria superoxide measurements as measured by 5 µM MitoSOX dye in shScr and shDIAPH1 hiPSC-CMs upon H/R. Scale bar 200 µm (n = 4 biologically independent samples, unpaired t test was performed for p value). d Mitochondria pore opening measured by flow-cytometry using mitochondrial Permeability Transition Pore Assay Kit in HiPSC-CMs under H/R conditions (n = 4 biologically independent samples, one-tailed Wilcoxon rank-sum test was performed for p value). e Leica SP8 Confocal microscopy at 63× magnification and respective quantification of the relative intensity of JC-1 (red/green) dye to measure mitochondria membrane potential in shScr and shDIAPH1 hiPSC-CMs under H/R (n = 4 biologically independent samples, unpaired t test was performed for p value). f Leica SP8 Confocal microscopy images of fluorescent MitoTimer signal of young (green) and old (red fluorescence) mitochondria in HiPSC-CMs. Quantification represents the ratio of the relative intensity of green to red indicating the turnover of Mito (n = 4 biologically independent samples, Kruskal–Wallis with Dunn’s pairwise comparison test was performed for p value). g Represents oxygen consumption rate (OCR) measurements obtained from Seahorse. The panel also represents basal mitochondrial respiration and ATP production rate extrapolated from OCR measurement (n = 5 for shScr and 6 for shDIAPH1 biologically independent samples, Welch’s unpaired t-test was performed for p value). h Leica SP8 confocal images and respective quantification of Annexin V-FITC staining to measure apoptosis in shScr and shDIAPH1 HiPSC-CMs exposed to H/R. Scale bar 50 µM. (n = 4 biologically independent samples, unpaired t-test was performed for p value). i Leica SP8 confocal microscopy images and respective quantification of ER-ID® Red staining to measure ER stress in shScr and shDIAPH1 HiPSC-CMs exposed to H/R conditions. Scale bar 50 µM. (n = 4 biologically independent samples, ANOVA with TukeyHSD test was performed for p value). j Live cell ER lumen and cytosolic calcium measurements in shScr and shDiaph1 H9C2 cells exposed to H/R using 20 µM Mag-Fluo-4 AM and 5 µM Fluo-4 AM dye, respectively. ER, calcium content was estimated as the delta between basal and caffeine-stimulated fluorescence measurements (n = 6 biologically independent samples for fluo4 and n = 8 for Mag-fluo4, unpaired t-test was performed for p value). k Fluorometric assay to measure phosphatidylserine and phosphatidylcholine levels using TECAN infinity pro 200 plate reader (n = 4 biologically independent samples, Welch’s ANOVA with Games–Howell pairwise comparison test for phosphatidylcholine and ANOVA with TukeyHSD pairwise comparison for phosphatidylserine was performed for p value). Data are presented as the mean ± SEM. A normality test was performed for all groups. All statistics and source data are provided as a Source Data file.

