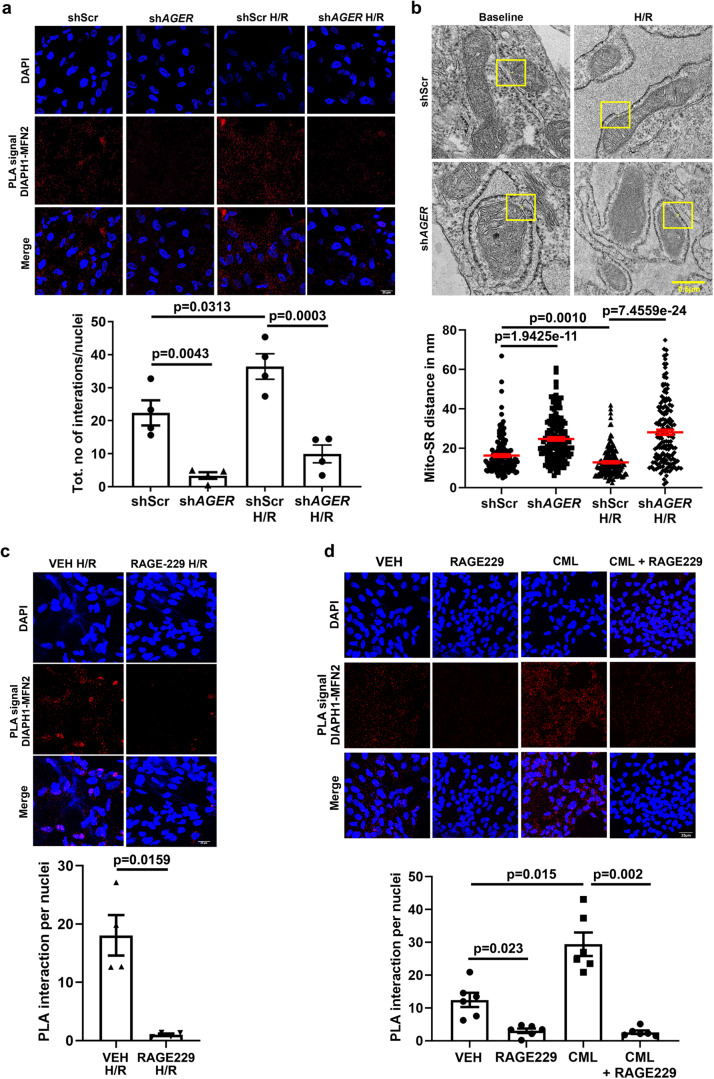
Fig. 6. RAGE–DIAPH1 regulates Mito-SR/ER distance and DIAPH1–MFN2 interactions in HiPSC-CMs.
a. Leica SP8 confocal microscopy images at 63X magnification of DIAPH1–MFN2 DUOLINK PLA signal and corresponding quantification of signal in shAGER and shScr HiPSC-CMs under baseline and H/R conditions. Scale bar 25 µm. (n = 4 biologically independent samples, ANOVA with TukeyHSD pairwise comparison test was performed for p value). b Represents TEM images to measure Mito-SR/ER distance and quantification using NIH-ImageJ software in shAGER and shScr HiPSC-CMs under baseline and H/R conditions. Scale bar 0.5 µm. (Each value represents Mito-SR/ER distance in nm originating from four biologically independent samples, Kruskal–Wallis with Dunn’s pairwise comparison test was performed for p values) c Leica SP8 confocal microscopy images at 63× magnification of DIAPH1–MFN2 DUOLINK PLA signal and corresponding quantification in HiPSC-CMs treated with RAGE229, 10 µM, for 1 h under baseline and H/R conditions. Scale bar 25 µm. (n = 4 biologically independent samples, unpaired t-test was performed for p value). d Treatment with CML-AGE, 500 µg/ml, for 1 h and RAGE229, 10 µM, for 1 h. For combined treatment, RAGE229 was added 10 min prior to the addition of CML-AGE treatment for 1 h. Scale bar 25 µm. (n = 6 biologically independent samples, Welch’s ANOVA with Games–Howell pairwise comparison test was performed for p value). Data are presented as the mean ± SEM. All statistics and source data are provided as a Source Data file.

