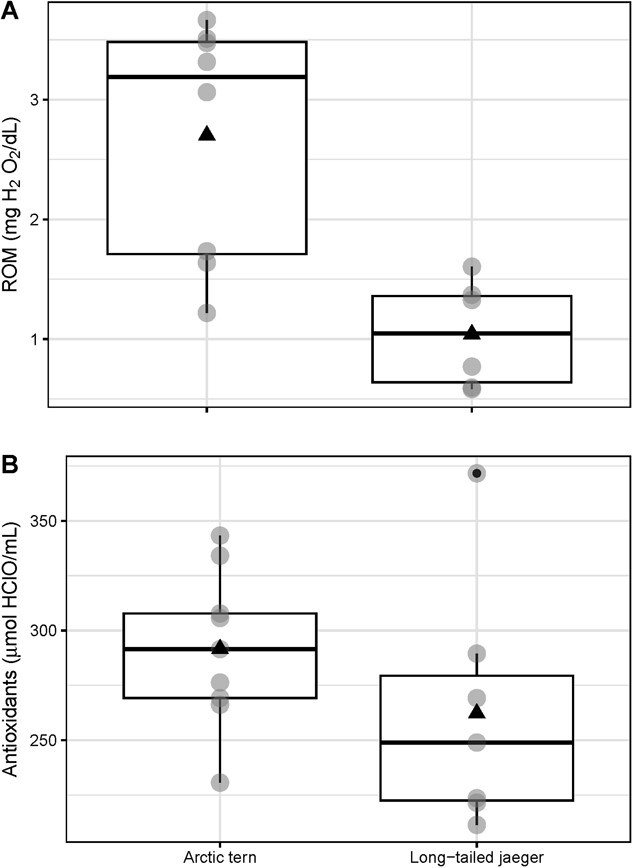
Figure 2.

Variability in oxidative physiology between species. A: Reactive Oxygen Metabolites (ROM), B: Antioxidants (OXY) and C: Arctic terns and long-tailed jaegers captured in Alaska, USA. Horizontal lines indicate the median. Triangle (▲) indicates the mean. Apparent differences between distribution of raw values are not significant when mass is included as a covariate (see Table 1).
