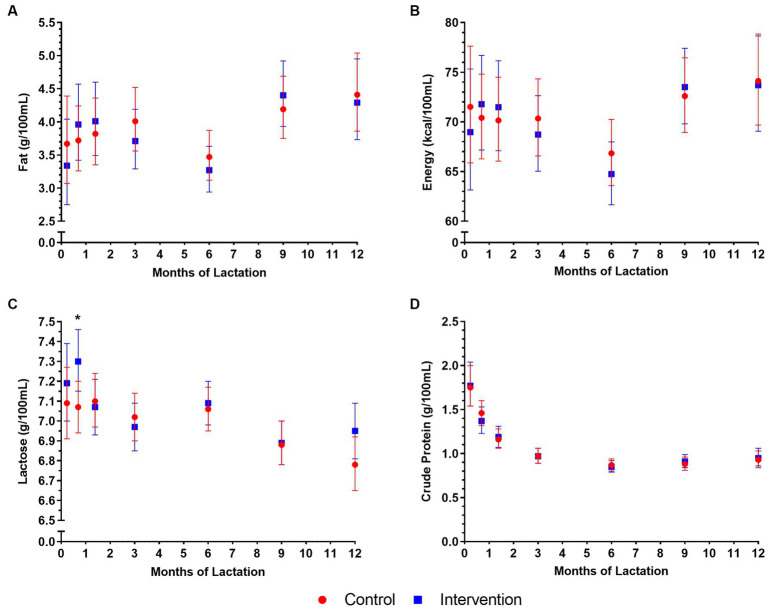
Figure 5.
Macronutrient concentrations in human milk (HM) in control and intervention groups in New Zealand in the NiPPeR study during 12 months of lactation: (A) fat, (B) energy, (C) lactose, and (D) crude protein. Data are the least-squares means (i.e., adjusted means) for each group, adjusted for randomisation group, visit, an interaction term (group*visit), maternal pre-pregnancy body mass index, gestational age at birth, and adherence. Error bars represent the respective 95% confidence intervals. *p < 0.05 for a difference between intervention and control groups at a given time point.

