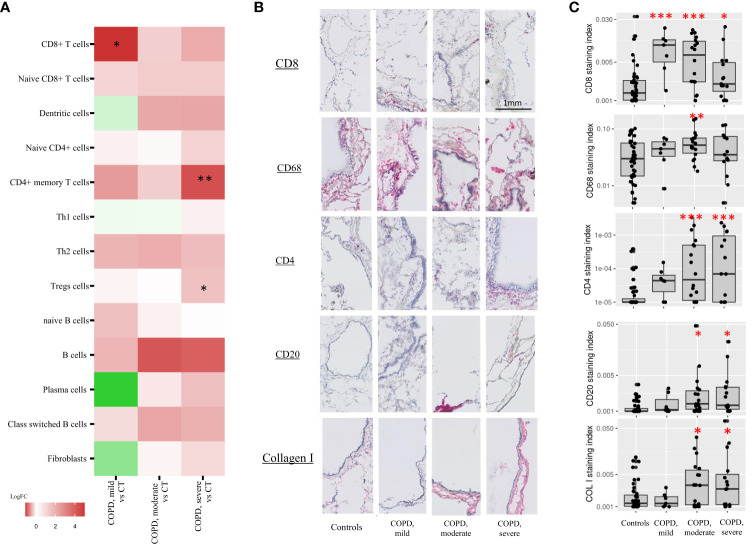
Figure 4.
Immune cell types cores composition. (A) xCell enrichment scores of cell types involved in the adaptive immune response and fibroblasts in COPD, moderate and –severe cores as compared with controls cores (CT). Each point corresponds to individual core data, * FDR<0.1, **FDR<0.01, ***FDR<0.001 versus controls by a linear mixed effects regression models including cores disease subgroups, age, and gender as fixed effect and patient as random effect. (B, C) Adaptive immune cell types and fibroblasts immunostainings (log2-transformed staining index). Each point corresponds to individual core data, * p<0.05, **p<0.01, ***p<0.001 vs controls by a linear mixed effects regression models including cores disease subgroups, age, and gender as fixed effect and patient as random effect.

