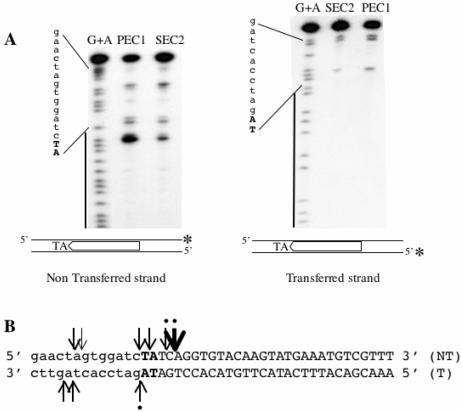
FIG. 4.
Cleavage positions on preformed SEC2 and PEC1. (A) The DNA contained in SEC2 and PEC1 was eluted from an EMSA gel and analyzed on a sequencing gel. An asterisk marks the position of the 32P. The G+A sequence from each probe was loaded as a marker. A black line on the left indicates the position of the ITR. The flanking TA dinucleotide is shown in bold capital letters. The non-ITR flanking DNA is shown in lowercase letters. (Left panel) Cleavage products obtained by using ITR70α as a probe. (Right panel) Cleavage products obtained by using ITR70γ as a probe. (B) Sequence of the DNA used in cleavage site determination. The cleavage sites are shown with arrows, either on the nontransferred strand (NT) or on the transferred strand (T). Dots indicate cleavages that had been described previously.

