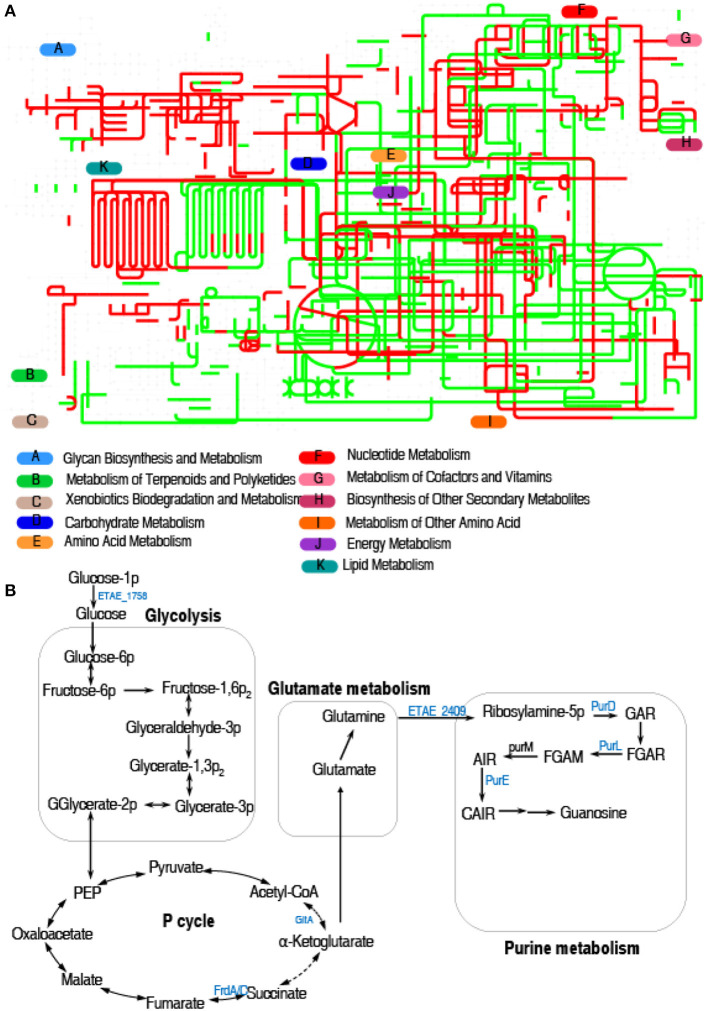
Figure 3.
Metabolic pathway analysis. (A) Analysis for metabolic profiling showed a better insight into the effects of differential abundance proteins (p < 0.05). Based on the EggNOG database (http://eggnog5.embl.de), metabolic network pathways are further analyzed using iPath2.0 (http://pathways.embl.de). Red, increase; green, decrease. (B) Metabolic schematic diagram of differential proteins. The identified downregulated proteins (green) involved in metabolism are all shown in the flowchart.

