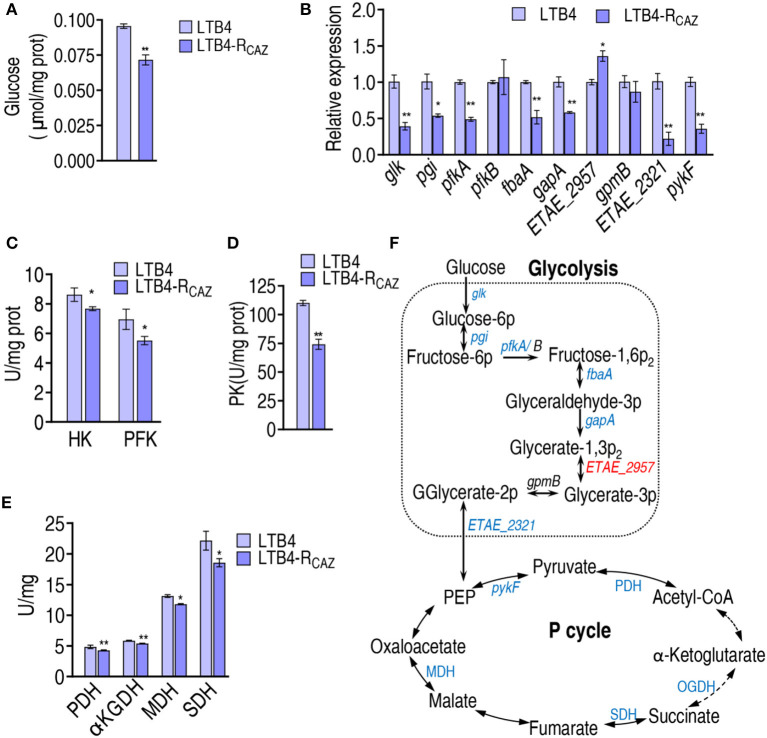
Figure 4.
Alteration of glycolysis and the P cycle. (A) Quantification of glucose in LTB4-S and LTB4-RCAZ. (B) qRT-PCR for expression of genes encoding glycolysis and pykF in the P cycle. (C) Activity of HK and PFH in glycolysis. (D) Activity of PK in the P cycle. (E) Activity of enzymes in the P cycle. (F) A summarizing map showing the alteration of glycolysis and the P cycle. *, P < 0.05; **, P < 0.01.

