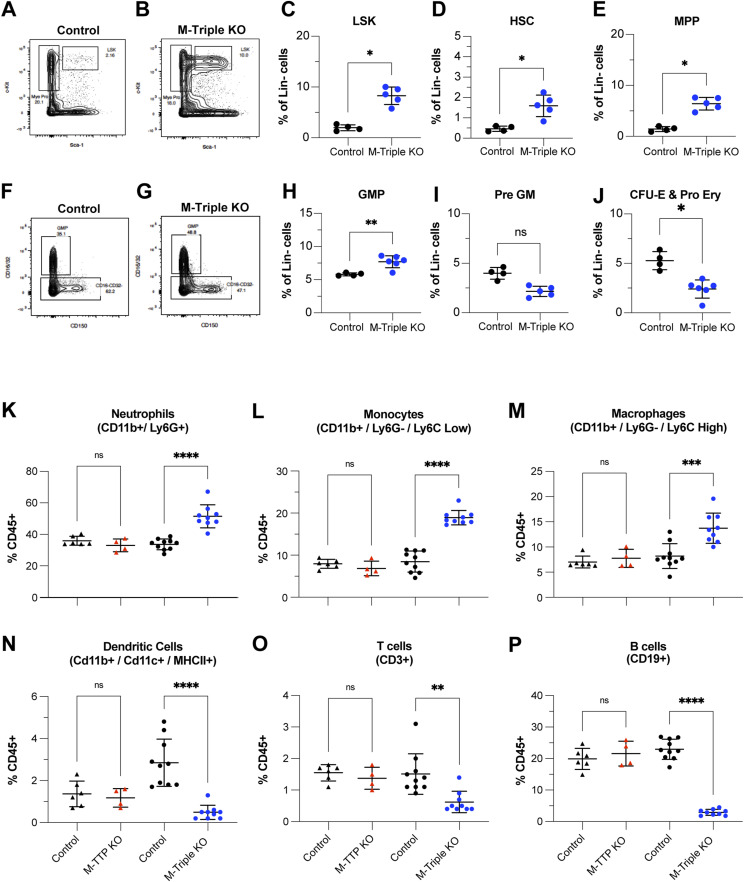
Figure 5. Effects of combined Zfp36 family member deficiency on myeloid cell populations in bone marrow.
(A, B, C, D, E, F, G, H, I, J, K, L, M, N, O, P) Hematopoietic stem cell, myeloid cell progenitor, and mature myeloid cell populations in the bone marrow were quantitated by flow cytometry. (A, B, F, G) Shown are representative plots of flow cytometric analyses of the (A, B) LSK (Lin−, Sca1+, cKit+) and (F, G) granulocyte–macrophage progenitor (Lin−, Sca1−, c-Kit+, CD41−, CD16/32+) populations in total bone marrow from male and female 9-wk-old control (N = 4) and M-triple KO (N = 6) mice. The rectangular outlines indicate the gated population and the percentages of cells in that population. The following cell populations were quantitated in total bone marrow from male and female 9-wk-old control (N = 4) and M-triple KO (N = 6) mice, and shown as percentages of Lin- cells as means ± SD: (C, D, E, H, I, J) LSK (Lin−, Sca1+, cKit+), (D) Hematopoietic stem cell (Lin−, Sca1+, cKit+, CD150+), (E) multipotent progenitor population (Lin−, Sca1+, c-Kit+, CD150-), (H) granulocyte–macrophage progenitor (Lin−, Sca1−, cKit+, CD41−, CD16/32+), (I) pre-GM progenitor (Lin−, Sca1−, cKit+, CD41−, CD16/32−, CD150−, Endoglin−), and (J) colony forming unit-erythroid and pro-erythroid progenitors (Lin−, Sca1−, c-Kit+, CD41−, CD16/32−, CD150−, Endoglin+). *P < 0.05, determined by unpaired, two-tailed t tests with Welch’s correction. (K, L, M, N, O, P) The following mature myeloid and lymphoid cell populations were quantitated in total bone marrow from M-TTP KO (N = 4), M-TTP control (N = 6), M-Triple KO (N = 9), and control mice (N = 10) at 7–9 wk of age by flow cytometry, and shown as percentages of CD45+ cells as means ± SD: (K) neutrophils (CD45+/CD11b+/Ly6G+), (L) monocytes (CD45+/CD11b+/Ly6G-/Ly6C high), (M) macrophages (CD45+/CD11b+/Ly6G-/Ly6C low), (N) dendritic cells (CD45+/CD11b+/CD11c+/MHCII+), (O) T cells (Cd45+, CD3+), and (P) B cells (CD45+, CD19+). *P < 0.05; **P < 0.01; ***P < 0.001; ****P < 0.0001, determined by unpaired, two-tailed t tests with Welch’s correction.

