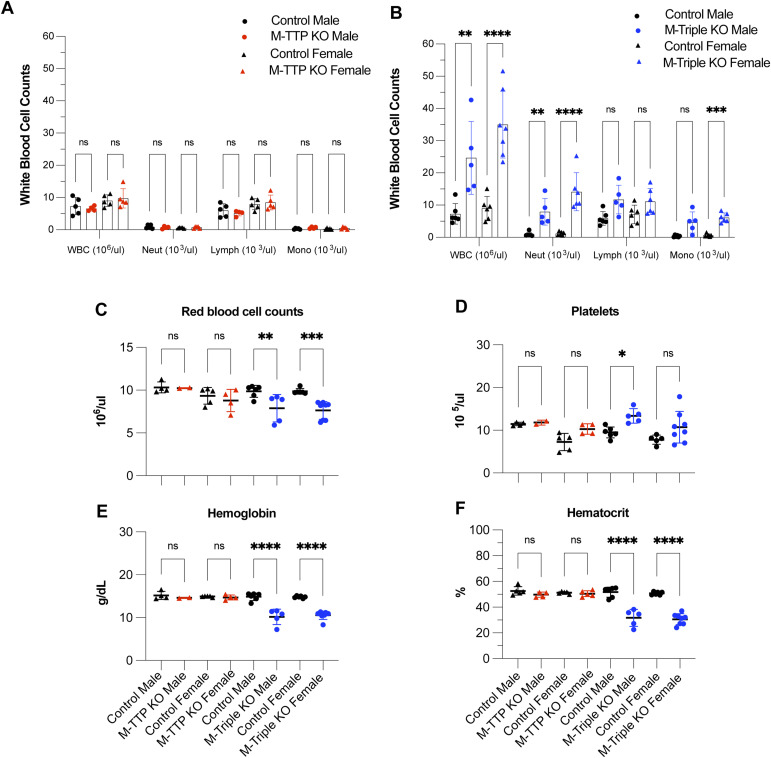
Figure 6. Peripheral blood analysis.
Complete blood counts were performed on peripheral blood from both male and female M-TTP KO (N = 5), M-TTP control (N = 5), M-triple KO, and control mice (N = 6) at 7–9 wk of age. (A, B) The total white blood count and absolute white blood cell differential (neut: neutrophils; lymph: lymphocytes; mono: monocytes) counts in (A) M-TTP KO and M-TTP control and (B) M-triple KO and controls are shown as means ± SD. (C, D, E, F) The (C) total RBC, (D) platelets (Plts), (E) hemoglobin (Hgb) concentration, and (F) hematocrit (Hct) counts are shown as means ± SD. *P < 0.05; **P < 0.01; ***P < 0.001; ****P < 0.0001; determined by two-way ANOVA with Šídák’s multiple comparison test.

