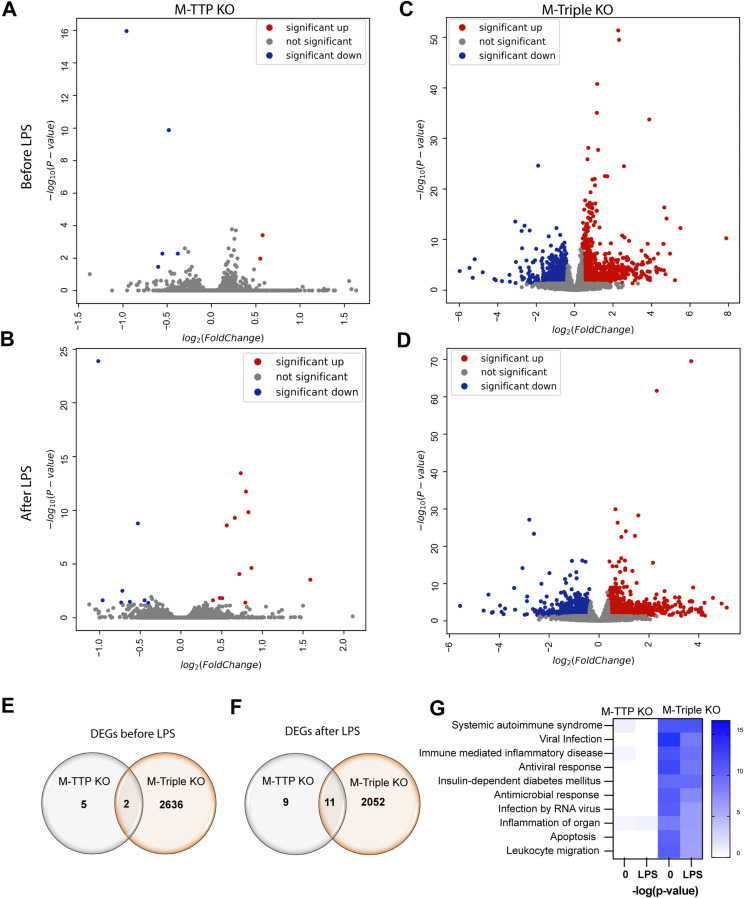
Figure 8. RNA-seq analysis of differentially regulated transcripts in BMDM.
BMDM from 9-wk-old male controls, M-TTP KO, and M-triple KO mice were treated with or without 1 μg/ml LPS for 1 h. (A, B, C, D) Volcano plots showing differentially expressed genes in BMDM from controls, M-TTP KO, and M-triple KO mice before (A, B) and after 1 h of LPS treatment (C, D). Significantly up-regulated transcripts whose means were at least 1.3fold above control values are shown in red, whereas the transcripts down-regulated to a comparable extent are shown in blue. Transcripts with no significant change between control and KO are shown in grey. (E, F) Venn diagrams demonstrate the overlap in the numbers of transcripts up- or down-regulated in M-TTP KO compared with M-triple KO cells (E) before and (F) after LPS treatment. (G) Heatmaps are shown indicating the top 10 involved pathways, with white showing no change and blue showing a highly significant P-value for a given disease and biological function enriched in TTP KO and triple KO macrophages, compared with controls before and after LPS treatment, determined by Ingenuity Pathway Analysis.

