

This randomized clinical trial examines data from patients with mild Alzheimer disease receiving BIIB080 to assess changes in tau biomarkers associated with cognitive decline, including cerebrospinal fluid total tau and phosphorylated tau 181 and tau positron emission tomography.
Key Points
Question
Does BIIB080, an antisense oligonucleotide that targets MAPT pre–messenger RNA, reduce tau biomarkers associated with cognitive decline in patients with mild Alzheimer disease?
Findings
This randomized clinical trial found that BIIB080 administration induced reductions from baseline in cerebrospinal fluid total tau and phosphorylated tau 181 in a dose- and time-dependent manner. Brain neurofibrillary tangles measured with tau positron emission tomography were reduced from baseline across all brain regions assessed.
Meaning
BIIB080 can reduce biomarkers associated with tau pathophysiology in patients with mild Alzheimer disease.
Abstract
Importance
Accumulation of hyperphosphorylated, tangled microtubule-associated protein tau (MAPT) is a pathological hallmark of Alzheimer disease (AD) associated with disease progression and cognitive decline.
Objective
To evaluate the effect of tau synthesis reduction on tau biomarkers in patients with mild AD.
Design, Setting, and Participants
This randomized clinical trial was a double-blind, placebo-controlled 36-week multiple-ascending dose (MAD) phase 1b trial (October 2017 to September 2020), followed by a 64- or 71-week open-label long-term extension (LTE) (October 2019 to May 2022). After being assessed for eligibility at 12 sites in Canada and Europe, participants with mild AD and confirmed amyloid pathology were randomized 3:1 (BIIB080:placebo) in 4 dose cohorts.
Intervention
Intrathecal administration of BIIB080, a MAPT-targeting antisense oligonucleotide, or placebo. Active dose arms included 10 mg every 4 weeks, 30 mg every 4 weeks, 60 mg every 4 weeks, and 115 mg every 12 weeks during the MAD period and 60 mg every 12 weeks or 115 mg every 12 weeks during the LTE.
Main Outcome and Measures
The original primary end point was safety. Additionally, BIIB080, total tau (t-tau), and phosphorylated tau 181 (p-tau181) cerebrospinal fluid (CSF) concentrations were evaluated. Tau positron emission tomography (PET) was collected in a substudy, and standard uptake value ratios (SUVRs) were calculated in a priori-defined composite regions of interest.
Results
Of 102 participants assessed for eligibility, 46 participants with mild AD were enrolled; 23 (50%) were female, and mean (SD) age was 65.8 (5.70) years. BIIB080 was generally well tolerated and was associated with a dose-dependent reduction in CSF t-tau and p-tau181 in the MAD period (56% reduction; 95% CI, 50% to 62%; and 51% reduction; 95% CI, 38% to 63%, of CSF t-tau in the 2 higher-dose cohorts) that continued and/or was maintained through quarterly dosing in the LTE. Tau PET demonstrated reduced accumulation vs placebo at week 25 (n = 13). At week 100, tau PET showed a reduction from baseline across all regions assessed (n = 12), with the largest reductions from baseline observed in the temporal composite (−0.71 SUVR; 95% CI, −1.40 to −0.02). A moderate correlation was observed between model-predicted cumulative CSF drug exposure and tau PET change.
Conclusions and Relevance
In this randomized clinical trial, BIIB080 reduced tau biomarkers, including CSF t-tau, CSF p-tau181, and tau PET, which is associated with cognitive decline, in participants with mild AD. Effects of BIIB080 on biomarkers and clinical outcomes are being further evaluated in a phase 2 trial.
Trial Registration
ClinicalTrials.gov Identifier: NCT03186989
Introduction
Alzheimer disease (AD) is a progressive neurogenerative disorder characterized by comorbid pathologies, including extracellular amyloid plaques and intracellular hyperphosphorylated tau neurofibrillary tangles (NFTs).1 While amyloid pathology appears earlier in the course of disease, tau pathology emerges closer to symptom onset and is better correlated with cognitive decline.2 Biomarkers can quantify elements of tau biology and pathology. Elevation of cerebrospinal fluid (CSF) levels of total tau (t-tau) has been reported in multiple neurodegenerative disorders3 and is thought to reflect nonspecific neuronal degeneration in the brain, while CSF levels of phosphorylated tau species have been more closely linked to AD pathophysiology.4 Tau positron emission tomography (PET) allows for detection of NFTs in the brain and is the most direct assessment of tau pathology.
BIIB080 is a MAPT-targeting antisense oligonucleotide that selectively reduces MAPT messenger RNA (mRNA), decreasing the synthesis of tau protein. Preclinically, antisense oligonucleotide–mediated knockdown of MAPT mRNA in transgenic mice led to lowered tau protein and reversal of preexisting tau pathology.5 Clinically, a multiple ascending-dose (MAD) phase 1b study was completed in participants with mild AD, with the primary objective of evaluating the safety and tolerability of BIIB080. As previously published,6 BIIB080 was generally well tolerated. The majority of adverse events were mild or moderate in severity, of which the most common were headache, back pain, and post–lumbar puncture syndrome. Exploratory biomarkers were also assessed. BIIB080 was associated with dose-dependent reductions in CSF tau and phosphorylated tau 181 (p-tau181) during the MAD period. Here, we present data evaluating the effects of BIIB080 on CSF tau biomarkers during a long-term extension (LTE) period of that study and on NFTs as measured with tau PET during the MAD and LTE periods.
Methods
Study Design and Participants for the MAD Period
Details of clinical study NCT03186989 have been reported elsewhere.6 Forty-six participants aged 50 to 74 years with mild AD and confirmed amyloid pathology were enrolled. The trial was conducted in accordance with the Declaration of Helsinki and all applicable International Council for Harmonisation and Good Clinical Practice guidelines. Investigators were required to obtain institutional review board or ethics committee approval before beginning the study. All participants provided written informed consent before participating in any study-related activities. The trial protocol and statistical analysis plan are provided in Supplement 1 and Supplement 2, respectively.
In the MAD study period, participants were intrathecally dosed for 13 weeks with either placebo or 10 mg every 4 weeks (cohort A), 30 mg every 4 weeks (cohort B), 60 mg every 4 weeks (cohort C), or 115 mg every 12 weeks (cohort D) of BIIB080, followed by a 24-week posttreatment observation period (eFigure 1 in Supplement 3). A tau PET substudy was introduced partway through the study and thus was only available during the MAD period for participants in cohorts C and D. Relevant demographic and baseline characteristics for all enrolled participants as well as the participants in the tau PET substudy during the MAD period are shown in eTables 1 and 2 in Supplement 3.
Study Design and Participants for the LTE
Following completion of the MAD study period, participants were eligible for entry into the LTE study. Participants in MAD cohorts C and D were able to seamlessly transition to the LTE period, while patients in MAD cohorts A and B had a variable gap ranging from 5 to 19 months between completion of the MAD and commencement of the LTE. Participants in the LTE study period were dosed for 48 weeks with either 60 mg every 12 weeks (those in MAD cohorts A, B, or C) or 115 mg every 12 weeks (those in MAD cohort D), followed by a 16- or 23-week posttreatment observation period. This resulted in 6 total groups for analysis (Figure 1). Tables with relevant demographics and baseline characteristics for all participants enrolled in the LTE as well as the participants in the tau PET substudy during the LTE are shown in eTables 3 and 4 in Supplement 3.
Figure 1. Patient Flow During the Multiple-Ascending Dose (MAD) and Long-Term Extension (LTE) Periods.
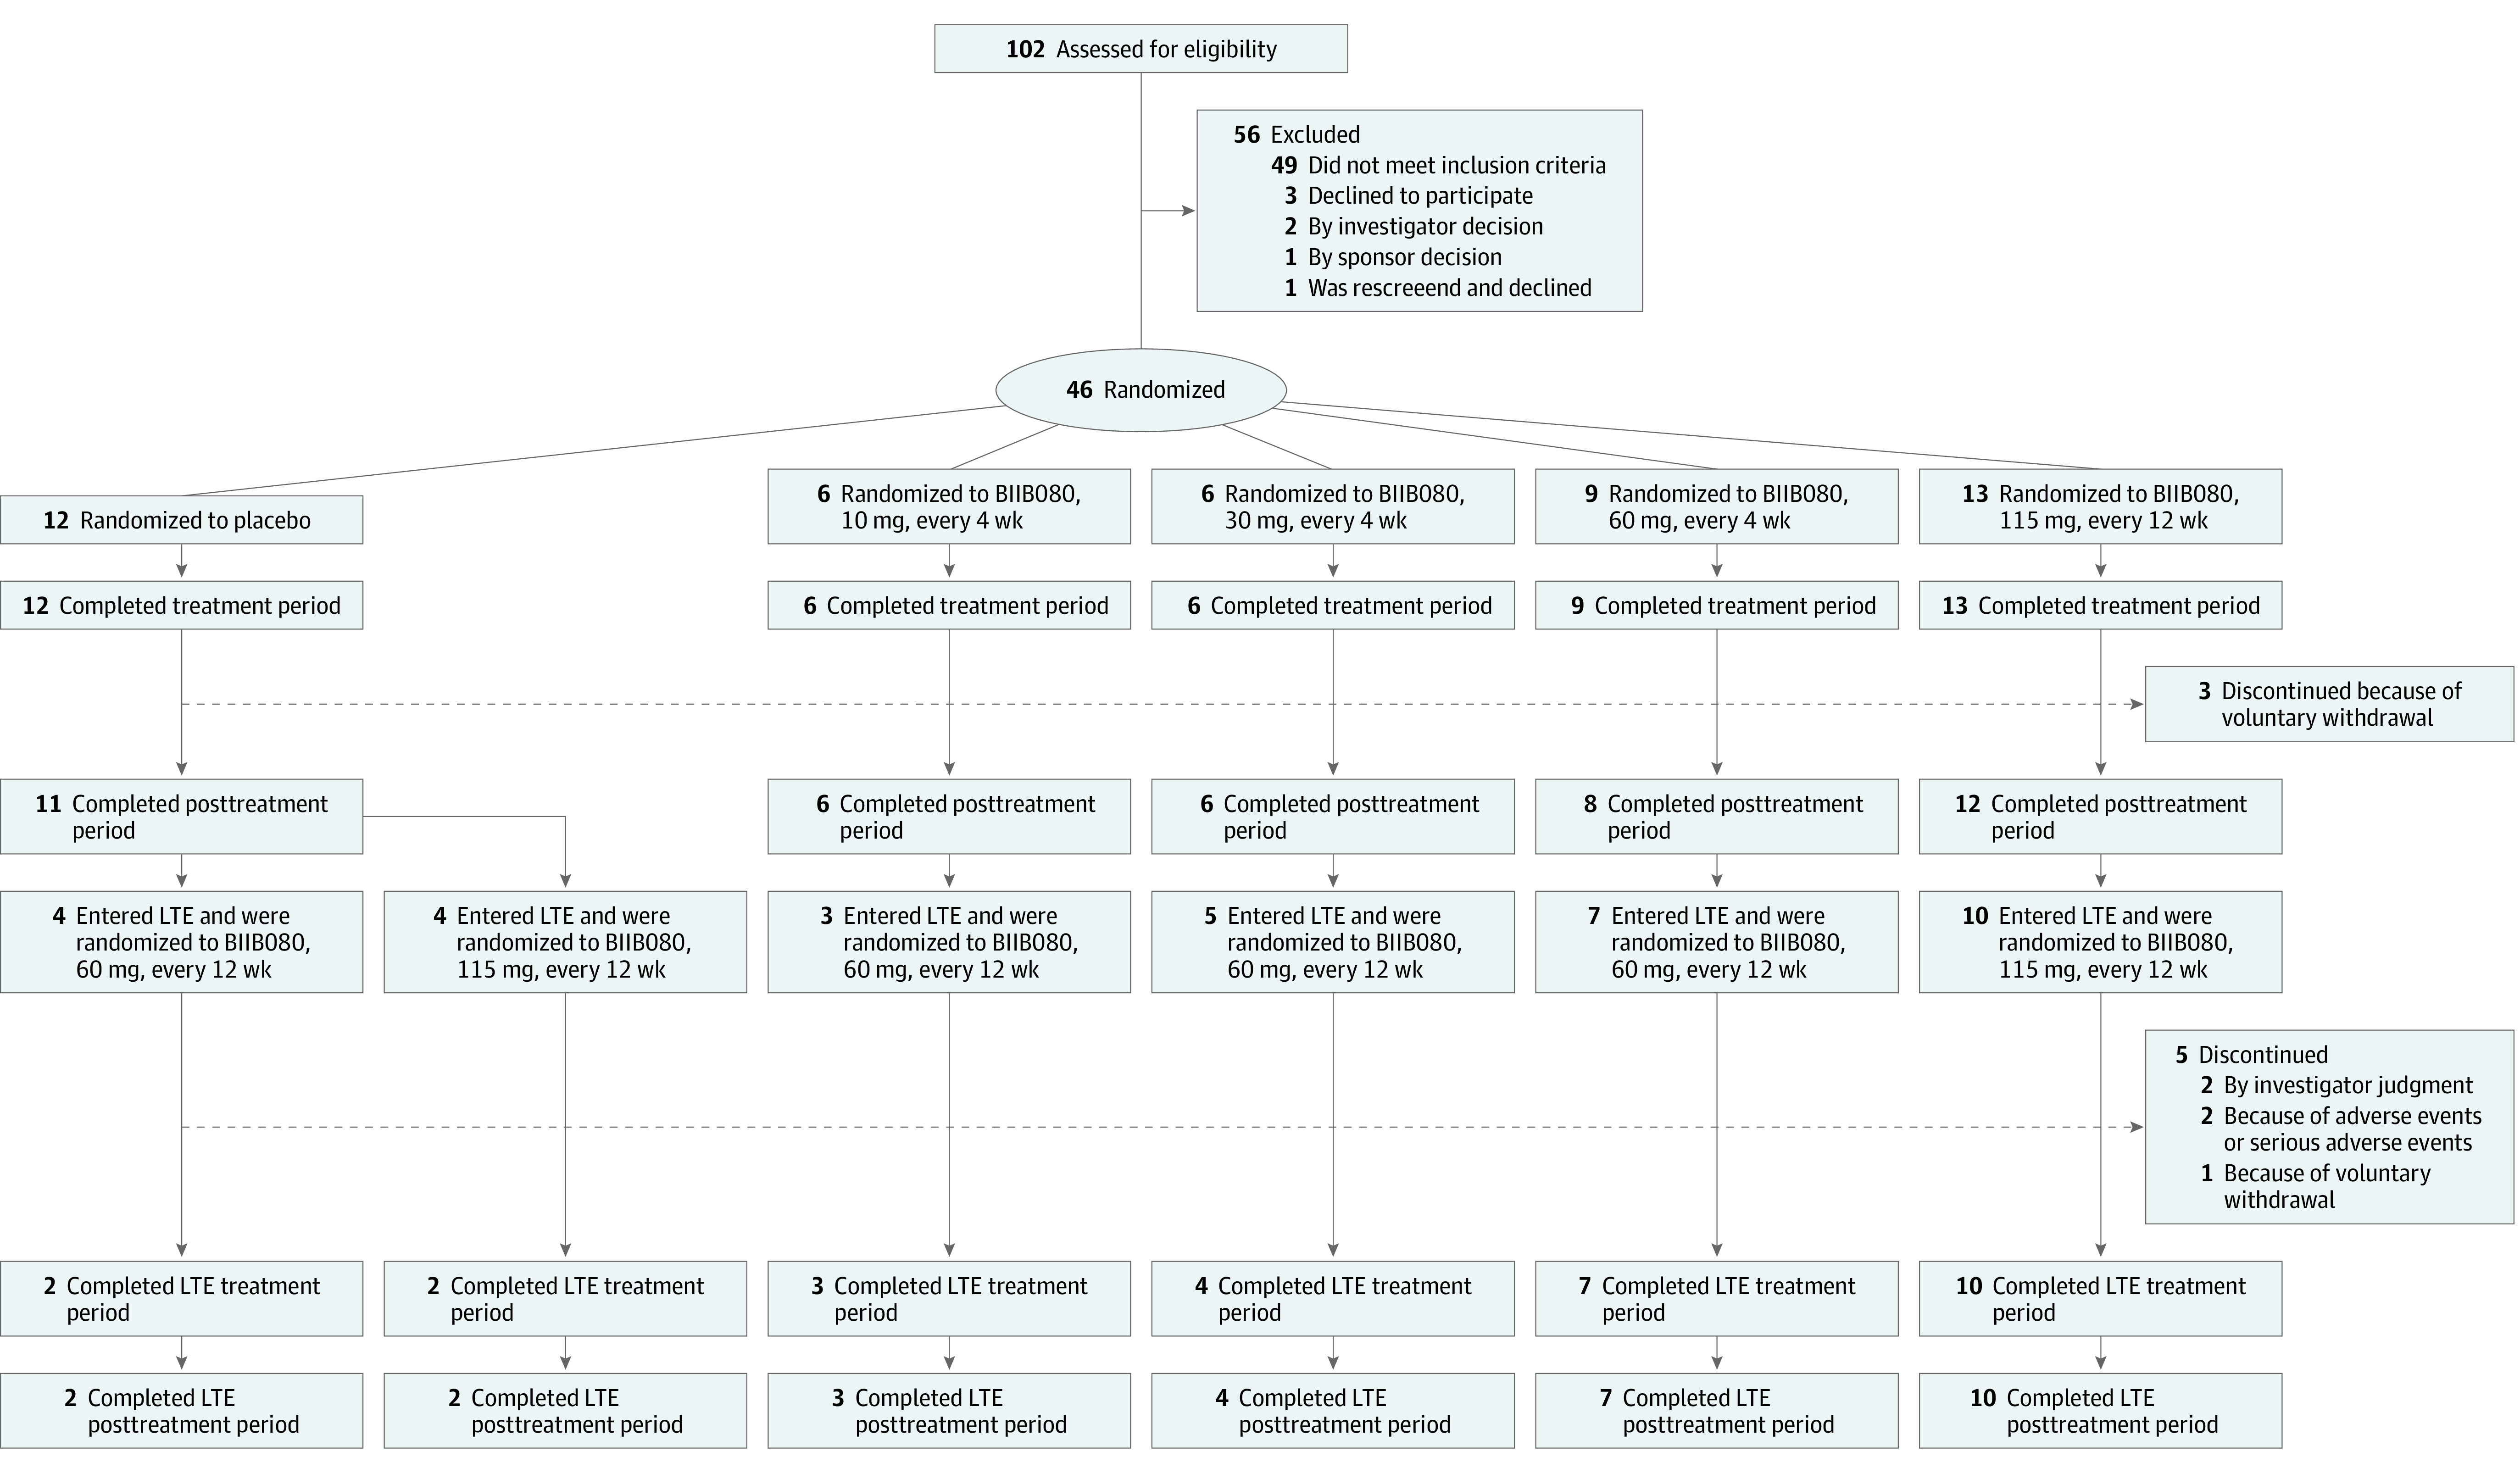
Eligible patients were randomly assigned in a 3:1 ratio to receive BIIB080 or placebo in all cohorts of the MAD period. Participants in cohorts A, B, and C who transitioned to the LTE all received BIIB080, 60 mg, every 12 weeks, while participants in cohort D who transitioned to the LTE all received BIIB080, 115 mg, every 12 weeks.
Biomarker Assessments
CSF samples were collected from all participants at screening, before drug administration at each dosing visit, and up to every 4 weeks during the posttreatment observation periods of the MAD and LTE. Samples were analyzed for CSF t-tau and CSF p-tau181 using the Elecsys platform (Roche Diagnostics). The Roche t-tau (or total-tau assay) detects the 6 isoforms or fragments of the tau protein present in human CSF, while the Roche p-tau (or phospho-tau assay) detects tau protein, or fragments thereof, phosphorylated at threonine 181. For participants enrolled in the imaging substudy, baseline tau PET scans were acquired using [18F]-MK6240 at screening (for those enrolled in the substudy at study start) or on entry into the LTE (for those enrolled in the substudy only during the LTE). Longitudinal scans were acquired at week 25 in the MAD period and at week 100 in the LTE period. Scans consisted of 6 300-second frames acquired 90 minutes after a target injection of 185 MBq (5.0 mCi) ± 10% of [18F]-MK6240. Each participant’s tau PET scan was motion-corrected, averaged, spatially smoothed, co-registered to their 3-dimension–T1 MRI, normalized to Montreal Neurological Institute space, and then segmented using the Hammers template.7 Standard uptake value ratios (SUVRs) were derived from the following a priori–defined lobar composite regions of interest (ROIs) using the ventral cerebellum as a reference region: medial temporal, temporal, parietal, cingulate, frontal, and occipital.8 Analysis was conducted without the use of partial volume correction. A supplemental analysis of the longitudinal tau PET data was conducted to assess the effect of a different processing pipeline that incorporated partial volume correction on the results (eMethods in Supplement 3). For estimation of longitudinal whole-brain, hippocampal, and lateral-ventricular volumes, each participant’s 3-dimension–T1 was processed using a validated pipeline implemented in VivoQuant.
Statistical and Exposure-Response Analyses
Unless otherwise specified, MAD baseline values were used in the analyses. The percentage change from baseline for CSF t-tau and p-tau181 at each postbaseline visit in the MAD + LTE period was summarized using descriptive statistics by LTE treatment group. The tau PET SUVR change from baseline at week 25 was analyzed for each of the composite ROIs using an analysis of covariance (ANCOVA) model with fixed effects of MAD treatment group and baseline SUVR value. The change from baseline SUVR at week 100 was analyzed using an ANCOVA model with fixed effects of LTE treatment group and baseline SUVR value. These tau PET analyses included participants from cohort C (60 mg every 4 weeks → 60 mg every 12 weeks), cohort D (115 mg every 12 weeks → 115 mg every 12 weeks), and cohort D (placebo → 115 mg every 12 weeks) who had tau PET scans collected at screening in the MAD period.
The relationship between cumulative drug exposure and the tau PET SUVR change from baseline was assessed using partial Pearson correlation, adjusting for baseline tau PET SUVR. The correlation analysis was conducted for the active treatment period, which for participants receiving active drug during the MAD included both the MAD and LTE periods and for participants receiving placebo during the MAD included the LTE period only. Cumulative drug exposure in the CSF for each participant was based on a population pharmacokinetic model developed with available pharmacokinetic data from the study and was determined by the area under the curve of model-predicted CSF drug concentration from the beginning of active treatment to the last CSF sampling time before the PET scan. For participants receiving placebo during the MAD, the LTE baseline scan (the last scan before the first dose of BIIB080 in the LTE) was used as the baseline for this correlation analysis, while for participants receiving BIIB080 during the MAD, the screening tau PET scan was used as the baseline.
Results
CSF t-Tau and p-Tau181
To evaluate proof of mechanism of the study drug, levels of t-tau and p-tau181 in the CSF were evaluated. Results from the placebo-controlled MAD study have been previously reported.6 Briefly, the placebo group maintained stable levels of both analytes throughout the duration of the MAD period, in line with prior natural history studies,9,10,11 whereas the BIIB080-treated groups demonstrated dose-dependent decreases in both analytes during the 13-week treatment period (Figure 2, eTables 6 and 7, and eFigure 2 in Supplement 3). Levels of CSF t-tau continued to decrease during the posttreatment period, resulting in a 56% (95% CI, 50%-62%) and 51% (95% CI, 38%-63%) mean reduction from baseline at the end of the MAD in cohort C (60 mg every 4 weeks → 60 mg every 12 weeks) and cohort D (115 mg every 12 weeks → 115 mg every 12 weeks), respectively. Levels of CSF p-tau181 also continued to decrease during the posttreatment period, resulting in a 56% (95% CI, 50%-62%) and 46% (95% CI, 33%-58%) mean reduction from baseline at the end of the MAD in cohort C (60 mg every 4 weeks → 60 mg every 12 weeks) and cohort D (115 mg every 12 weeks → 115 mg every 12 weeks), respectively. Of note, the concordant reductions of CSF t-tau and p-tau181 were expected based on the mechanism of the drug, as the antisense oligonucleotide reduces all forms of tau protein.
Figure 2. Effect of BIIB080 on Change From Baseline in Cerebrospinal Fluid (CSF) Total Tau (t-tau) and CSF Phosphorylated Tau 181 (p-tau181) in the Multiple-Ascending Dose (MAD) and Long-Term Extension (LTE) Periods.
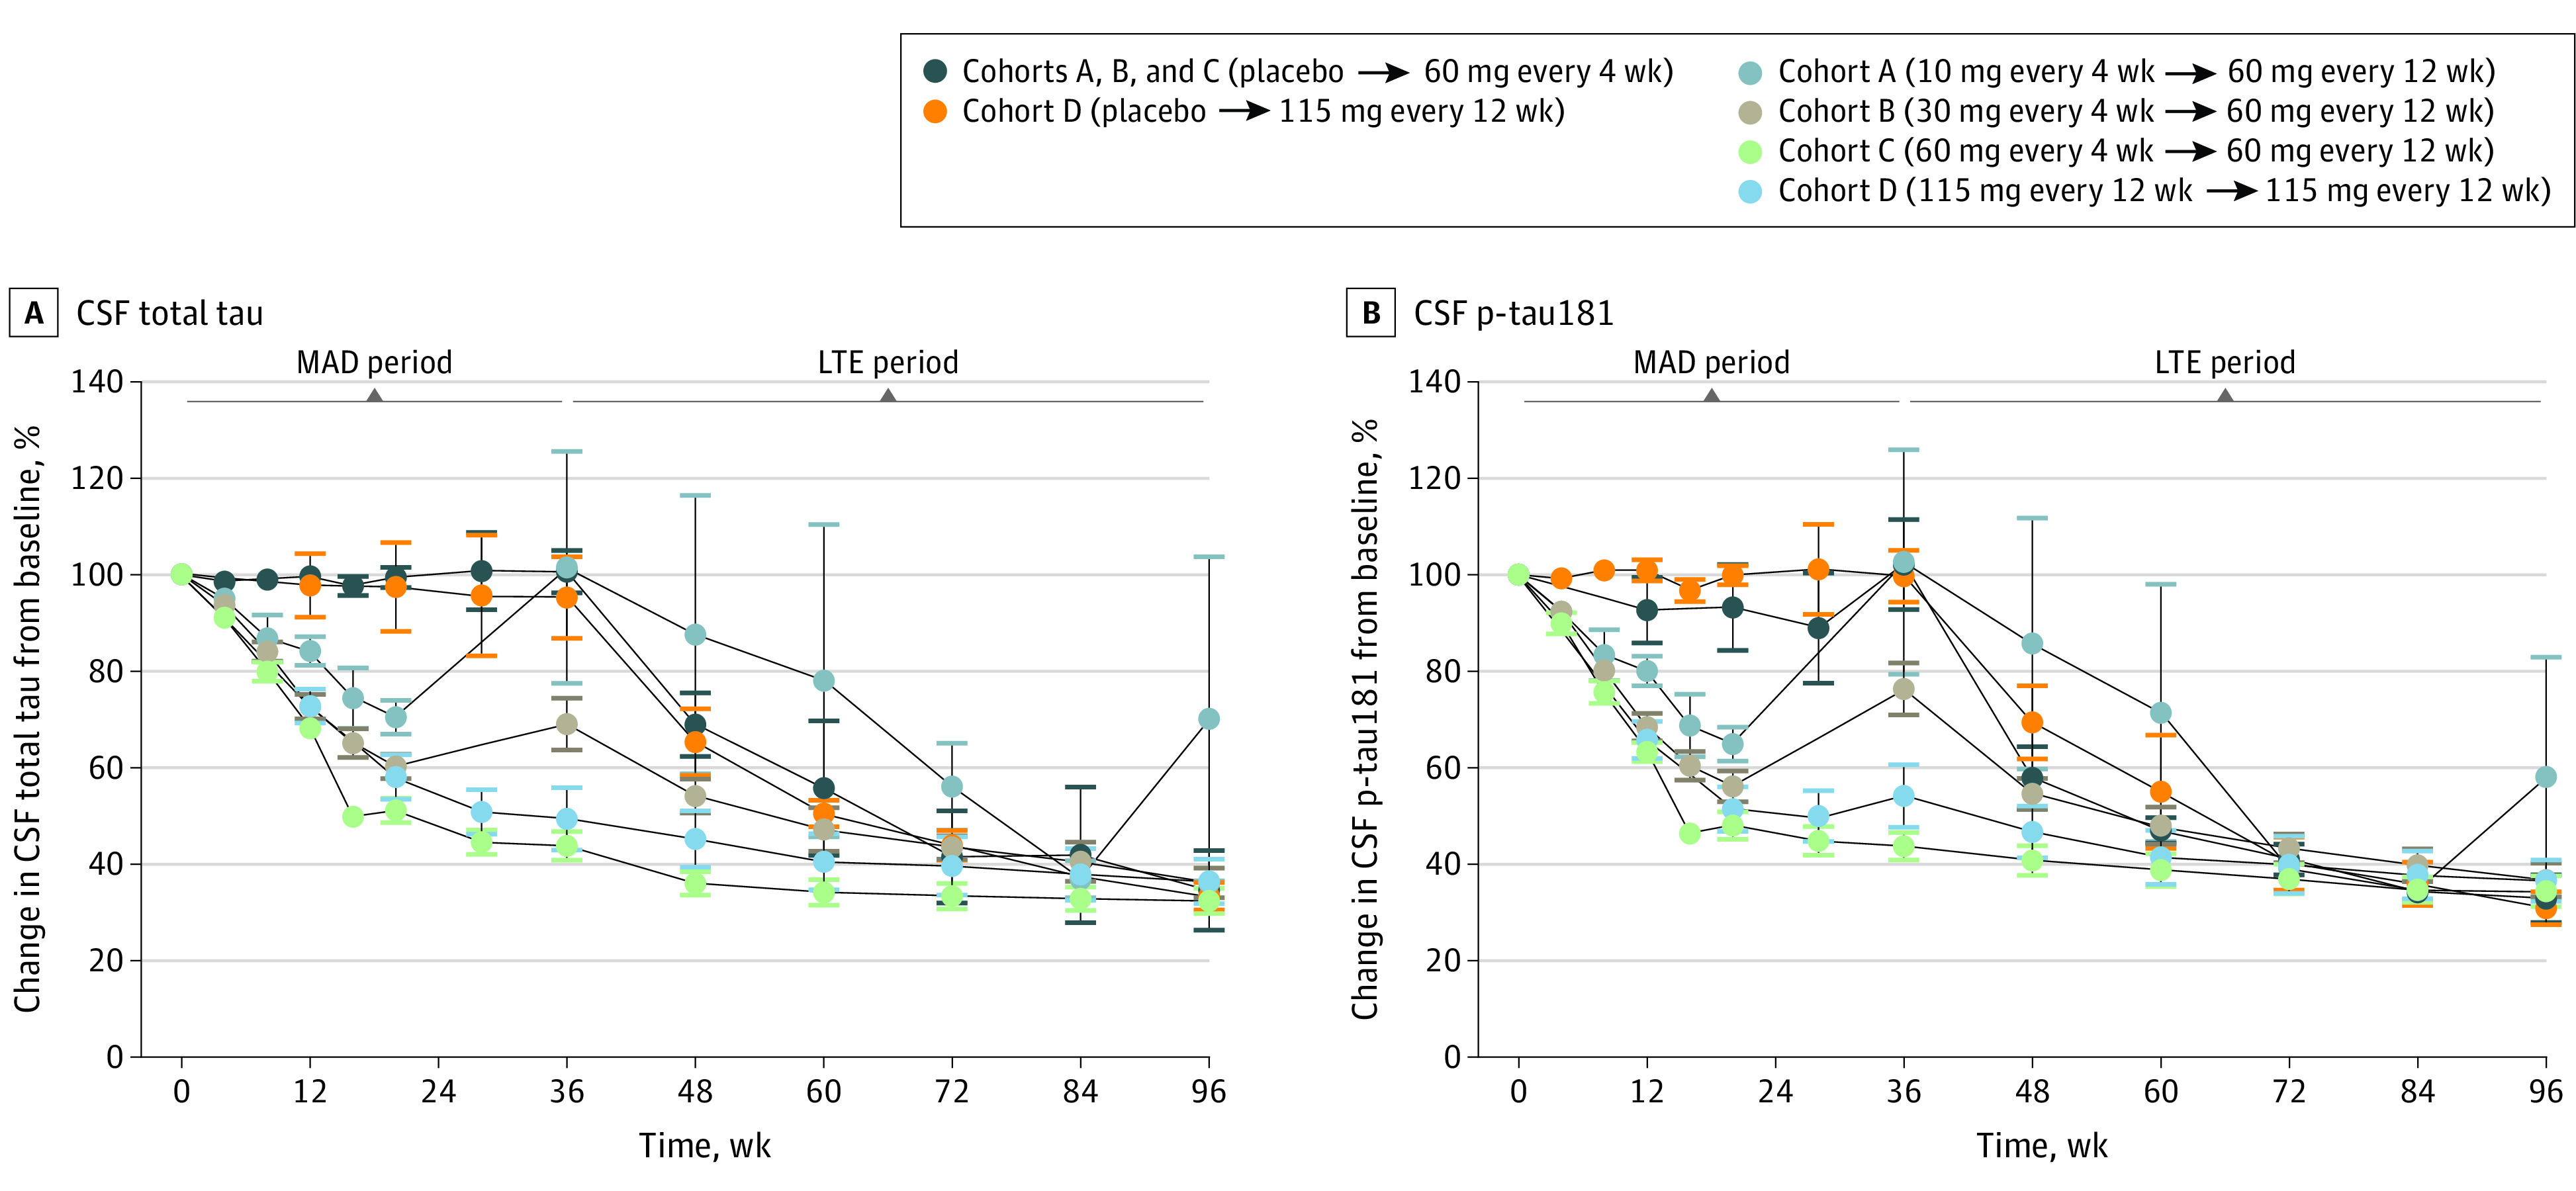
Effect of BIIB080 on levels of t-tau (A) and p-tau181 (B) in the CSF during MAD and LTE. To best summarize the full data set, all patients have been aligned on the same axis from 0 to 96 weeks. However, there was a variable gap between the end of the MAD and beginning of the LTE for cohorts A and B, and available visits at the end of the MAD and the beginning of the LTE have been collapsed into a single data point. For cohorts C and D, for which there was a seamless transition from the MAD to the LTE, no gap period exists. For visualization of the data set with chronologically accurate axes, see eFigure 2 in Supplement 3. Note that participants treated with placebo in cohorts A, B, and C were combined for analysis. Participants in the MAD cohorts A, B, and C who transitioned to the LTE all received BIIB080, 60 mg, every 12 weeks, while participants in cohort D who transitioned to the LTE all received BIIB080, 115 mg, every 12 weeks. A full table indicating the number of participants analyzed at each time point is presented in eTable 5 in Supplement 3. Full summary statistics for each time point are presented in eTables 6 and 7 in Supplement 3. Error bars represent SE.
In cohorts A and B, there was a variable gap period between the end of the MAD study period and the beginning of the LTE study period. At the beginning of the LTE study period, participants in cohort A (10 mg every 4 weeks → 60 mg every 12 weeks) and cohort B (30 mg every 4 weeks → 60 mg every 12 weeks) demonstrated a partial or complete rebound to baseline levels of CSF t-tau and p-tau181.
Levels of both analytes continued to decrease during the LTE period in all treatment groups. The mean reduction of CSF t-tau from baseline to the end of the LTE was 67% (95% CI, 62%-73%) in cohort C (60 mg every 4 weeks → 60 mg every 12 weeks) and 63% (95% CI, 54%-73%) in cohort D (115 mg every 12 weeks → 115 mg every 12 weeks). Similarly, the mean reduction of CSF p-tau181 from baseline to the end of the LTE was 66% (95% CI, 59%-72%) in cohort C (60 mg every 4 weeks → 60 mg every 12 weeks) and 63% (95% CI, 55%-72%) in cohort D (115 mg every 12 weeks → 115 mg every 12 weeks). Comparable reductions were observed by the end of the LTE in all other groups, including patients who received placebo in the MAD period.
Tau PET
To evaluate the effect of BIIB080 on pathologic tau species in the brain, participants were evaluated in a tau PET substudy using the [18F]-MK6240 tau tracer. At week 25 of the MAD, the placebo group (cohort D [placebo → 115 mg every 12 weeks]) demonstrated an increase from baseline on tau PET SUVR in 5 of 6 ROIs, in line with prior natural history studies12,13,14,15 (Figure 3A and eTable 8 and eFigure 3 in Supplement 3). In contrast, cohort D (115 mg every 12 weeks → 115 mg every 12 weeks) showed reduced tau PET accumulation in 5 of 6 ROIs as compared with placebo. Cohort C (60 mg every 4 weeks → 60 mg every 12 weeks), which had the highest total exposure to drug during the MAD, demonstrated a decrease from baseline in tau PET SUVR across all ROIs. At week 100, when all participants had been treated with BIIB080, tau PET SUVR was reduced from baseline across all ROIs in all groups (Figure 3B and eTable 9 and eFigure 3 in Supplement 3). The largest reductions from baseline were observed in the medial temporal and temporal composites, which ranged from −0.71 SUVR (95% CI, −1.40 to −0.02) in the temporal composite for cohort D (placebo → 115 mg every 12 weeks) to −0.42 SUVR (95% CI, −1.11 to 0.27) in the temporal composite for cohort C (60 mg every 4 weeks → 60 mg every 12 weeks). Supplemental partial volume-corrected analysis revealed consistent group-level results (eTables 10 and 11 and eFigure 4 in Supplement 3), with the estimated magnitude of SUVR reduction from baseline to week 100 being larger across the majority of dose groups and ROIs when compared with the analysis that did not use partial volume correction, consistent with prior studies showing that partial volume correction increases sensitivity to longitudinal tau PET change.16
Figure 3. Effect of BIIB080 on Change From Baseline in Tau Positron Emission Tomography (PET) in the Multiple-Ascending Dose (MAD) and Long-Term Extension (LTE) Periods.
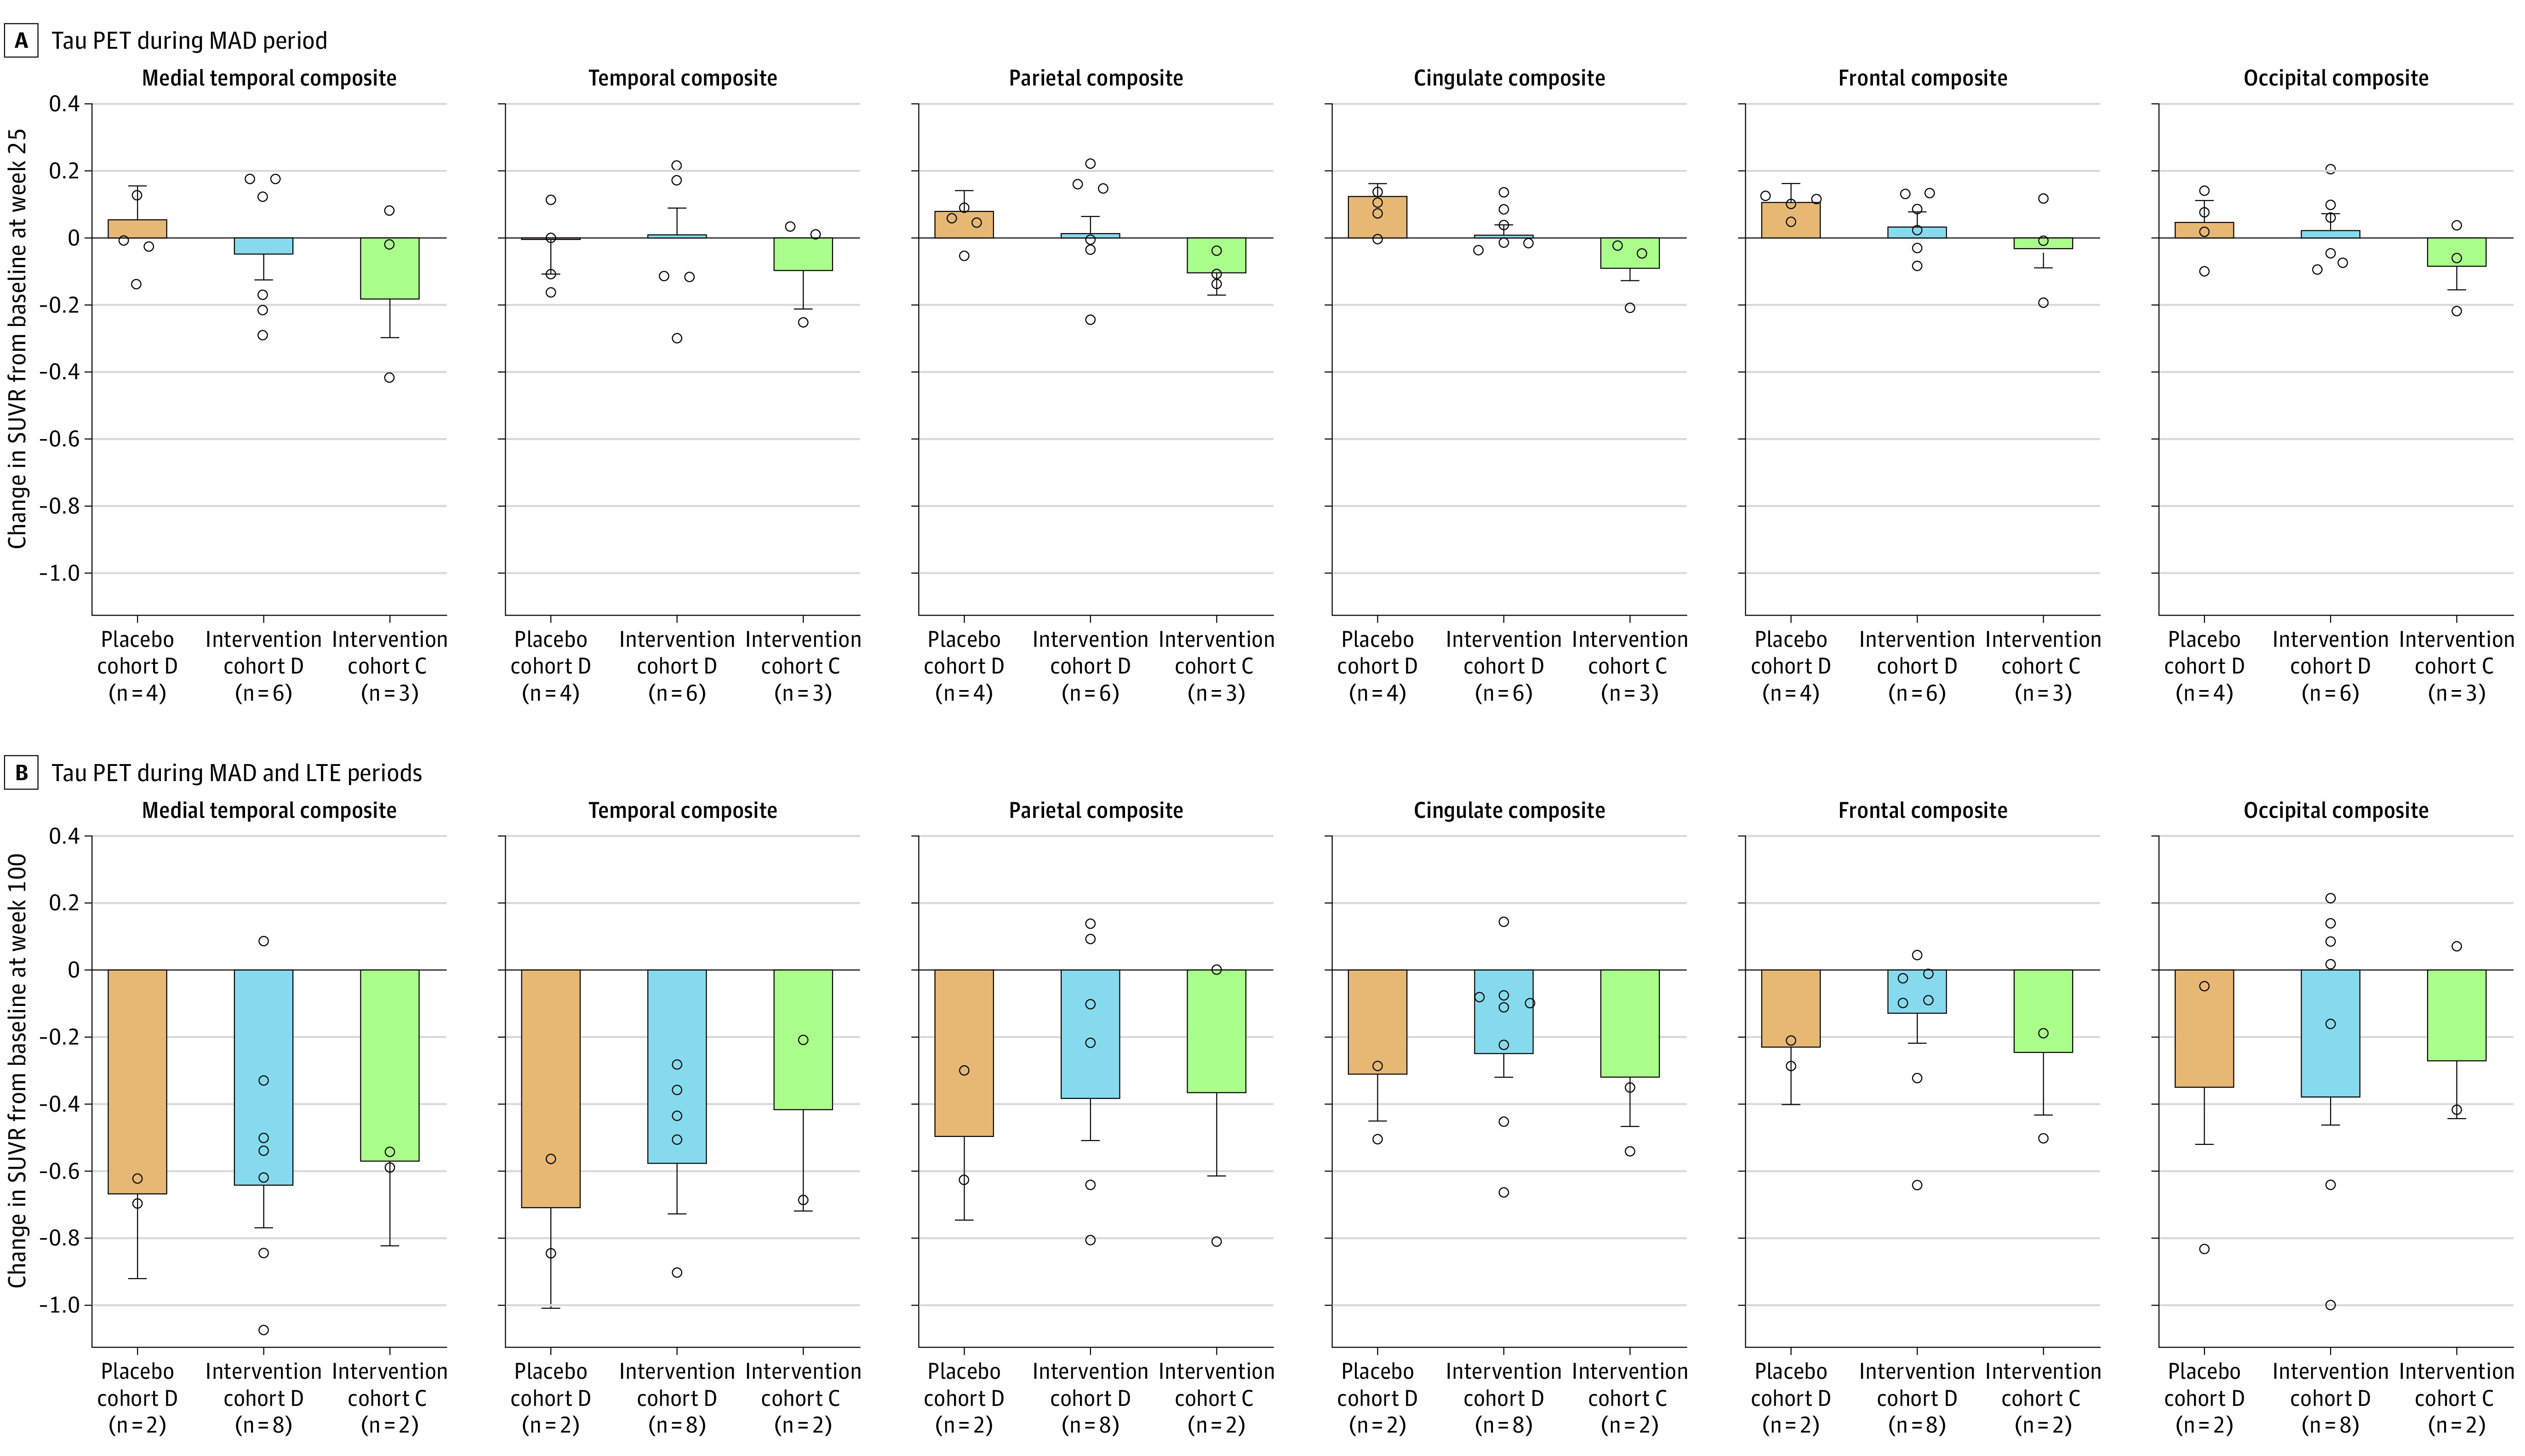
Bar plots show adjusted mean standard uptake value ratio (SUVR) change from baseline at week 25 (A) and week 100 in the LTE (B) for each treatment group. The adjusted mean SUVR change was estimated using an analysis of covariance model with fixed effects of treatment group and baseline SUVR value. Error bars represent SE. Circles represent the individual unadjusted tau PET SUVR change from baseline for each participant. Regimen details for the cohorts shown in each panel from left to right are as follows: orange, placebo cohort D, placebo → 115 mg every 12 weeks; blue, intervention cohort D, 115 mg every 12 weeks → 115 mg every 12 weeks; and green, intervention cohort C, 60 mg every 4 weeks → 60 mg every 12 weeks. Full summary statistics for the unadjusted tau PET SUVR change from baseline are presented in eTables 8 and 9 in Supplement 3.
Examination of longitudinal individual participant SUVR maps revealed results consistent with the group-level ROI analysis (Figure 4). Four participants who received placebo during the MAD period (cohort D [placebo → 115 mg every 12 weeks]) demonstrated modest but visually apparent tau PET accumulation bilaterally in the medial temporal, lateral temporal, and cingulate cortex from screening to week 25. For the 2 participants in cohort D (placebo → 115 mg every 12 weeks) with tau PET data at week 100, there was a clear reduction in tau PET SUVR in these same brain regions after receiving treatment in the LTE period. Visually apparent reductions in tau PET SUVR from screening to week 100 were observable for the majority of patients in cohort C (60 mg every 4 weeks → 60 mg every 12 weeks) and cohort D (115 mg every 12 weeks → 115 mg every 12 weeks).
Figure 4. Tau Positron Emission Tomography (PET) Image Examples From All Participants With Available Longitudinal Tau PET Data.
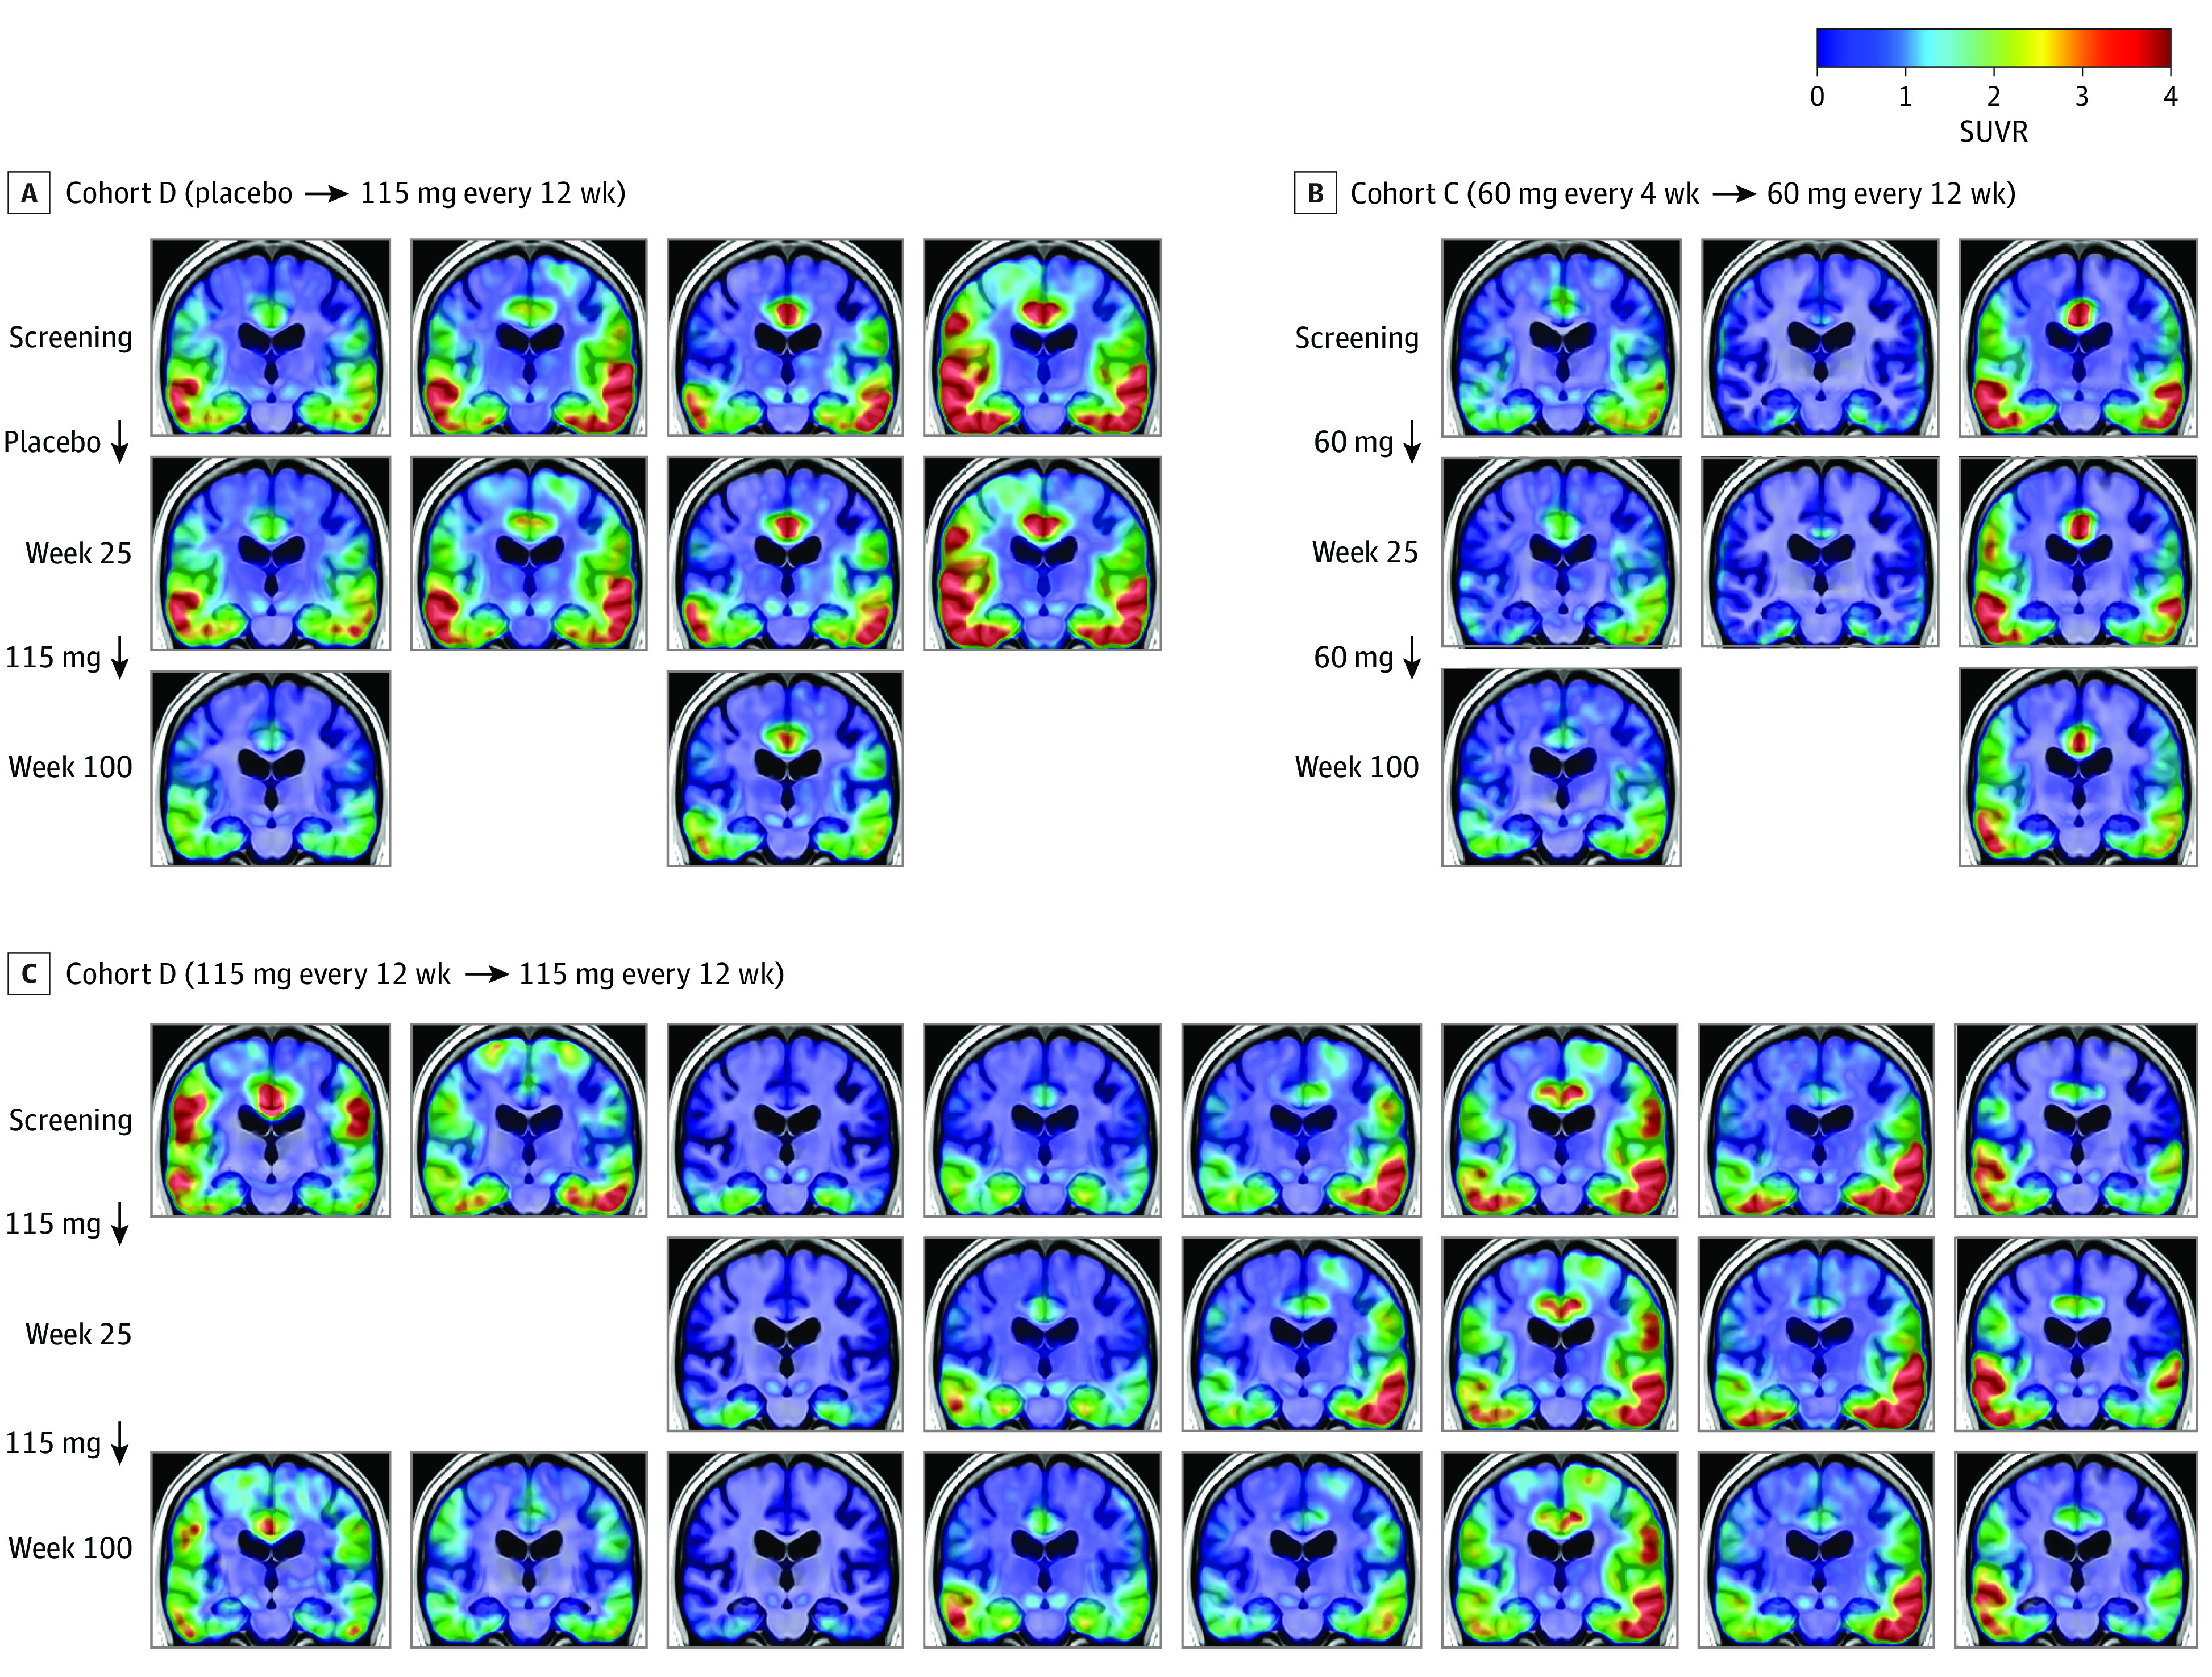
The selected coronal slice shows temporal and parietal regions associated with tau pathology in Alzheimer disease. SUVR indicates standard uptake value ratio.
BIIB080 Exposure and Tau PET Correlation
The correlation between tau PET SUVR change from baseline and the cumulative drug exposure was confounded by baseline tau PET SUVR (eFigure 5 in Supplement 3) because participants with higher baseline tau PET SUVR were associated with greater changes postbaseline. After removing the effect of baseline tau PET SUVR, we observed a correlation across all ROIs, suggesting that participants with higher drug exposure as measured by CSF pharmacokinetic area under the curve exhibited greater change from baseline in tau PET SUVR, with the magnitude of the relationship varying by ROI (Table and eFigure 6 in Supplement 3).
Table. Correlation Between Model-Predicted CSF Pharmacokinetic and Tau PET Change From Baseline.
| Composite ROI | Correlation (95% CI)a |
|---|---|
| Medial temporal | −0.60 (−0.86 to −0.10) |
| Temporal | −0.41 (−0.77 to 0.15) |
| Parietal | −0.68 (−0.89 to −0.23) |
| Cingulate | −0.61 (−0.86 to −0.12) |
| Frontal | −0.51 (−0.82 to 0.03) |
| Occipital | −0.33 (−0.73 to 0.25) |
Abbreviations: CSF, cerebrospinal fluid; PET, positron emission tomography; ROI, region of interest.
Partial Pearson r.
MRI Measures
Volumetric MRI results from the placebo-controlled MAD period have been previously reported.6 Briefly, at week 25, the mean change in lateral ventricular volume as a percentage of total intracranial volume was greater in the participants receiving active treatment than in those receiving placebo. At week 25, whole-brain volume decreased slightly from baseline in all groups and did not differ between patients receiving active treatment vs placebo. At week 100, a continued increase from baseline in cerebral ventricular volume and a continued reduction from baseline in whole-brain volume was observed across all treatment cohorts (eTable 12 in Supplement 3). In addition, subtle decreases in total hippocampal volume were observed from baseline to week 100 across all treatment cohorts. The clinical significance of the MRI findings described, if any, is currently unknown.
Discussion
BIIB080 is currently in development as a disease-modifying therapy for patients with mild cognitive impairment and mild AD. The phase 1b study involving mild AD participants showed that administration of BIIB080 resulted in a robust and sustained reduction of CSF t-tau and CSF p-tau181, the downstream products of the MAPT mRNA. The sustained reduction of CSF t-tau and p-tau181 during the posttreatment period indicates that less frequent dosing of intrathecally delivered antisense oligonucleotides can achieve robust soluble tau reduction, and as a result, BIIB080 treatment arms with quarterly and biannual dosing are being evaluated in the ongoing phase 2 study. Further, tau PET measurements demonstrated that less frequent dosing affected aggregated pathologic tau in the brain, which is thought to be a key driver of neurodegeneration and cognitive decline.2
Elevated p-tau in CSF has been interpreted as a key driver of the accumulation and spread of NFTs, with levels increasing through preclinical and prodromal early symptomatic stages and then plateauing.17,18 In the current study, suppression of CSF t-tau and p-tau levels over 100 weeks was associated with a reduction in tau NFTs as measured by PET across the brain, including in patients with mild dementia and in patients with advanced tau pathology (Figure 4). Our results are consistent with preclinical work showing that suppression of tau protein production with a MAPT antisense oligonucleotide reduces soluble tau protein concentrations and reverses aggregated tau pathology.5 These results are consistent with the hypothesized role of CSF tau in the aggregation and spread of parenchymal tau pathology, even after CSF tau levels have plateaued. However, assessing the causative relationship between CSF tau and pathologic parenchymal tau, as well as confirming the biological mechanisms of NFT reduction, will require additional studies.
Several clinical trials have shown that amyloid β–directed immunotherapies can decrease soluble tau biomarkers and slow tau PET accumulation as compared with placebo.8,19,20,21 However, the findings of the current study suggest that directly targeting tau synthesis may have a greater impact on parenchymal tau, not only slowing NFT accumulation but reducing NFTs from baseline levels, and therefore may be a valuable therapeutic strategy even in symptomatic stages of disease.
Limitations
The exploratory nature of these analyses, as well as the small sample sizes and restricted demographics, limit statistical analysis and warrant caution when interpreting the results. In addition, the lack of a placebo-control group during the LTE should be taken into consideration when interpreting the reduction from baseline in tau PET SUVR at week 100. BIIB080 will be evaluated in a phase 2 trial (NCT05399888) in a larger and broader population to better understand the temporal and spatial dynamics of these biomarker effects and their relationship with clinical outcomes.
Conclusions
In this phase 1b randomized clinical trial, BIIB080 reduced tau biomarkers, in particular tau PET, which is associated with cognitive decline, suggesting a novel approach to affect the underlying pathophysiology of Alzheimer disease.
Trial protocol
Statistical analysis plan
eMethods. Partial volume corrected tau PET analysis
eTable 1. MAD baseline characteristics: All study participants
eTable 2. MAD baseline characteristics: Tau PET substudy participants with baseline and end-of-MAD scans
eTable 3. MAD baseline characteristics: Tau PET substudy participants with baseline and end-of-LTE scans
eTable 4. MAD baseline characteristics: LTE participants
eTable 5. Number of participants in each treatment group analyzed at each timepoint for CSF t-tau and p-tau181
eTable 6. Summary statistics for % change from baseline of CSF t-tau
eTable 7. Summary statistics for % change from baseline of CSF p-tau181
eTable 8. Summary statistics for change from baseline of tau PET SUVR at Week 25 by composite region
eTable 9. Summary statistics for change from baseline of tau PET SUVR at Week 100 by composite region
eTable 10. Summary statistics for change from baseline of partial volume-corrected tau PET SUVR at Week 25 by composite region
eTable 11. Summary statistics for change from baseline of partial volume-corrected tau PET SUVR at Week 100 by composite region
eTable 12. Ventricle, Hippocampus and Whole Brain Volumes
eFigure 1. Dosing, CSF sampling, and tau PET scan schedule for the MAD and LTE
eFigure 2. Change from baseline on CSF t-tau and p-tau181 in the MAD and LTE
eFigure 3. Longitudinal tau PET for individual participants
eFigure 4. Change from baseline on partial volume corrected tau PET in the MAD and LTE
eFigure 5. Baseline tau PET vs change from baseline tau PET
eFigure 6. Relationship between model-predicted CSF PK and tau PET change from baseline
eReferences
Data sharing statement
References
- 1.DeTure MA, Dickson DW. The neuropathological diagnosis of Alzheimer’s disease. Mol Neurodegener. 2019;14(1):32. doi: 10.1186/s13024-019-0333-5 [DOI] [PMC free article] [PubMed] [Google Scholar]
- 2.Nelson PT, Alafuzoff I, Bigio EH, et al. Correlation of Alzheimer disease neuropathologic changes with cognitive status: a review of the literature. J Neuropathol Exp Neurol. 2012;71(5):362-381. doi: 10.1097/NEN.0b013e31825018f7 [DOI] [PMC free article] [PubMed] [Google Scholar]
- 3.Jack CR Jr, Bennett DA, Blennow K, et al. ; Contributors . NIA-AA Research Framework: toward a biological definition of Alzheimer’s disease. Alzheimers Dement. 2018;14(4):535-562. doi: 10.1016/j.jalz.2018.02.018 [DOI] [PMC free article] [PubMed] [Google Scholar]
- 4.Olsson B, Lautner R, Andreasson U, et al. CSF and blood biomarkers for the diagnosis of Alzheimer’s disease: a systematic review and meta-analysis. Lancet Neurol. 2016;15(7):673-684. doi: 10.1016/S1474-4422(16)00070-3 [DOI] [PubMed] [Google Scholar]
- 5.DeVos SL, Miller RL, Schoch KM, et al. Tau reduction prevents neuronal loss and reverses pathological tau deposition and seeding in mice with tauopathy. Sci Transl Med. 2017;9(374):eaag0481. doi: 10.1126/scitranslmed.aag0481 [DOI] [PMC free article] [PubMed] [Google Scholar]
- 6.Mummery CJ, Börjesson-Hanson A, Blackburn DJ, et al. Tau-targeting antisense oligonucleotide MAPTRx in mild Alzheimer’s disease: a phase 1b, randomized, placebo-controlled trial. Nat Med. 2023;29(6):1437-1447. doi: 10.1038/s41591-023-02326-3 [DOI] [PMC free article] [PubMed] [Google Scholar]
- 7.Hammers A, Allom R, Koepp MJ, et al. Three-dimensional maximum probability atlas of the human brain, with particular reference to the temporal lobe. Hum Brain Mapp. 2003;19(4):224-247. doi: 10.1002/hbm.10123 [DOI] [PMC free article] [PubMed] [Google Scholar]
- 8.Budd Haeberlein S, Aisen PS, Barkhof F, et al. Two randomized phase 3 studies of aducanumab in early Alzheimer’s disease. J Prev Alzheimers Dis. 2022;9(2):197-210. doi: 10.14283/jpad.2022.30 [DOI] [PubMed] [Google Scholar]
- 9.Blennow K, Zetterberg H, Minthon L, et al. Longitudinal stability of CSF biomarkers in Alzheimer’s disease. Neurosci Lett. 2007;419(1):18-22. doi: 10.1016/j.neulet.2007.03.064 [DOI] [PubMed] [Google Scholar]
- 10.Zetterberg H, Pedersen M, Lind K, et al. Intra-individual stability of CSF biomarkers for Alzheimer’s disease over two years. J Alzheimers Dis. 2007;12(3):255-260. doi: 10.3233/JAD-2007-12307 [DOI] [PubMed] [Google Scholar]
- 11.Mattsson N, Portelius E, Rolstad S, et al. Longitudinal cerebrospinal fluid biomarkers over four years in mild cognitive impairment. J Alzheimers Dis. 2012;30(4):767-778. doi: 10.3233/JAD-2012-120019 [DOI] [PubMed] [Google Scholar]
- 12.Harrison TM, La Joie R, Maass A, et al. Longitudinal tau accumulation and atrophy in aging and alzheimer disease. Ann Neurol. 2019;85(2):229-240. doi: 10.1002/ana.25406 [DOI] [PMC free article] [PubMed] [Google Scholar]
- 13.Pontecorvo MJ, Devous MD, Kennedy I, et al. A multicentre longitudinal study of flortaucipir (18F) in normal ageing, mild cognitive impairment and Alzheimer’s disease dementia. Brain. 2019;142(6):1723-1735. doi: 10.1093/brain/awz090 [DOI] [PMC free article] [PubMed] [Google Scholar]
- 14.Jack CR Jr, Wiste HJ, Schwarz CG, et al. Longitudinal tau PET in ageing and Alzheimer’s disease. Brain. 2018;141(5):1517-1528. doi: 10.1093/brain/awy059 [DOI] [PMC free article] [PubMed] [Google Scholar]
- 15.Cho H, Choi JY, Lee HS, et al. Progressive tau accumulation in Alzheimer disease: 2-year follow-up study. J Nucl Med. 2019;60(11):1611-1621. doi: 10.2967/jnumed.118.221697 [DOI] [PMC free article] [PubMed] [Google Scholar]
- 16.Mertens N, Michiels L, Vanderlinden G, et al. Impact of meningeal uptake and partial volume correction techniques on [18F]MK-6240 binding in aMCI patients and healthy controls. J Cereb Blood Flow Metab. 2022;42(7):1236-1246. doi: 10.1177/0271678X221076023 [DOI] [PMC free article] [PubMed] [Google Scholar]
- 17.Pichet Binette A, Franzmeier N, Spotorno N, et al. ; Alzheimer’s Disease Neuroimaging Initiative . Amyloid-associated increases in soluble tau relate to tau aggregation rates and cognitive decline in early Alzheimer’s disease. Nat Commun. 2022;13(1):6635. doi: 10.1038/s41467-022-34129-4 [DOI] [PMC free article] [PubMed] [Google Scholar]
- 18.Barthélemy NR, Bateman RJ, Hirtz C, et al. Cerebrospinal fluid phospho-tau T217 outperforms T181 as a biomarker for the differential diagnosis of Alzheimer’s disease and PET amyloid-positive patient identification. Alzheimers Res Ther. 2020;12(1):26. doi: 10.1186/s13195-020-00596-4 [DOI] [PMC free article] [PubMed] [Google Scholar]
- 19.van Dyck CH, Swanson CJ, Aisen P, et al. Lecanemab in early Alzheimer’s disease. N Engl J Med. 2023;388(1):9-21. doi: 10.1056/NEJMoa2212948 [DOI] [PubMed] [Google Scholar]
- 20.Pontecorvo MJ, Lu M, Burnham SC, et al. Association of donanemab treatment with exploratory plasma biomarkers in early symptomatic Alzheimer disease: a secondary analysis of the TRAILBLAZER-ALZ randomized clinical trial. JAMA Neurol. 2022;79(12):1250-1259. doi: 10.1001/jamaneurol.2022.3392 [DOI] [PMC free article] [PubMed] [Google Scholar]
- 21.Mintun MA, Lo AC, Duggan Evans C, et al. Donanemab in early Alzheimer’s disease. N Engl J Med. 2021;384(18):1691-1704. doi: 10.1056/NEJMoa2100708 [DOI] [PubMed] [Google Scholar]
Associated Data
This section collects any data citations, data availability statements, or supplementary materials included in this article.
Supplementary Materials
Trial protocol
Statistical analysis plan
eMethods. Partial volume corrected tau PET analysis
eTable 1. MAD baseline characteristics: All study participants
eTable 2. MAD baseline characteristics: Tau PET substudy participants with baseline and end-of-MAD scans
eTable 3. MAD baseline characteristics: Tau PET substudy participants with baseline and end-of-LTE scans
eTable 4. MAD baseline characteristics: LTE participants
eTable 5. Number of participants in each treatment group analyzed at each timepoint for CSF t-tau and p-tau181
eTable 6. Summary statistics for % change from baseline of CSF t-tau
eTable 7. Summary statistics for % change from baseline of CSF p-tau181
eTable 8. Summary statistics for change from baseline of tau PET SUVR at Week 25 by composite region
eTable 9. Summary statistics for change from baseline of tau PET SUVR at Week 100 by composite region
eTable 10. Summary statistics for change from baseline of partial volume-corrected tau PET SUVR at Week 25 by composite region
eTable 11. Summary statistics for change from baseline of partial volume-corrected tau PET SUVR at Week 100 by composite region
eTable 12. Ventricle, Hippocampus and Whole Brain Volumes
eFigure 1. Dosing, CSF sampling, and tau PET scan schedule for the MAD and LTE
eFigure 2. Change from baseline on CSF t-tau and p-tau181 in the MAD and LTE
eFigure 3. Longitudinal tau PET for individual participants
eFigure 4. Change from baseline on partial volume corrected tau PET in the MAD and LTE
eFigure 5. Baseline tau PET vs change from baseline tau PET
eFigure 6. Relationship between model-predicted CSF PK and tau PET change from baseline
eReferences
Data sharing statement