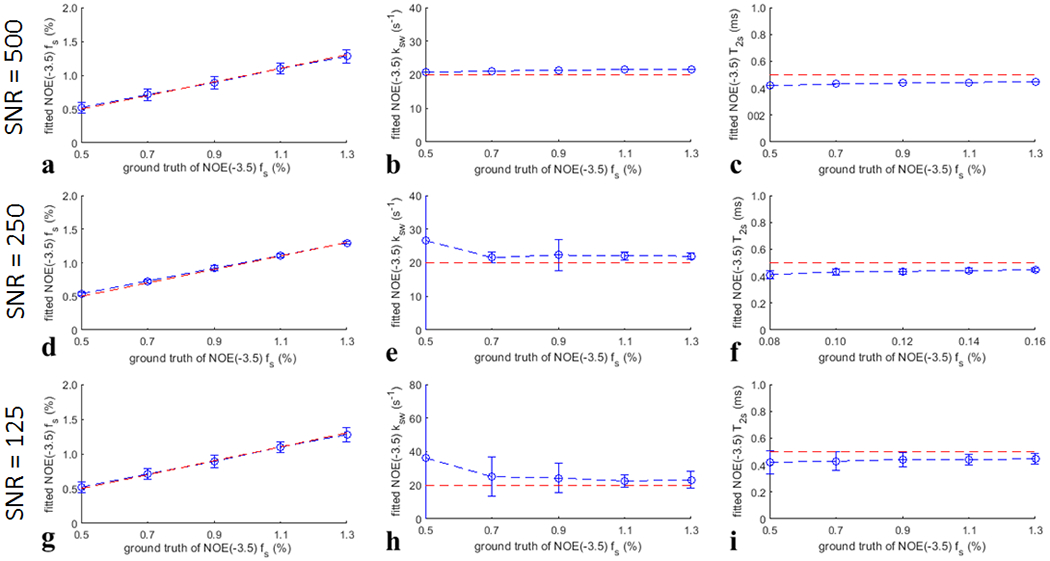
Fig. 2.

Monte Carlo simulation of the fitted NOE(−3.5) fs, NOE(−3.5) ksw, and NOE(−3.5) T2s (blue lines) from simulations with varied NOE(−3.5) fs, but constant NOE(−3.5) ksw and NOE(−3.5) T2s for different SNR. The ground truth of the fitted parameters (red lines) were also plotted for comparison.
