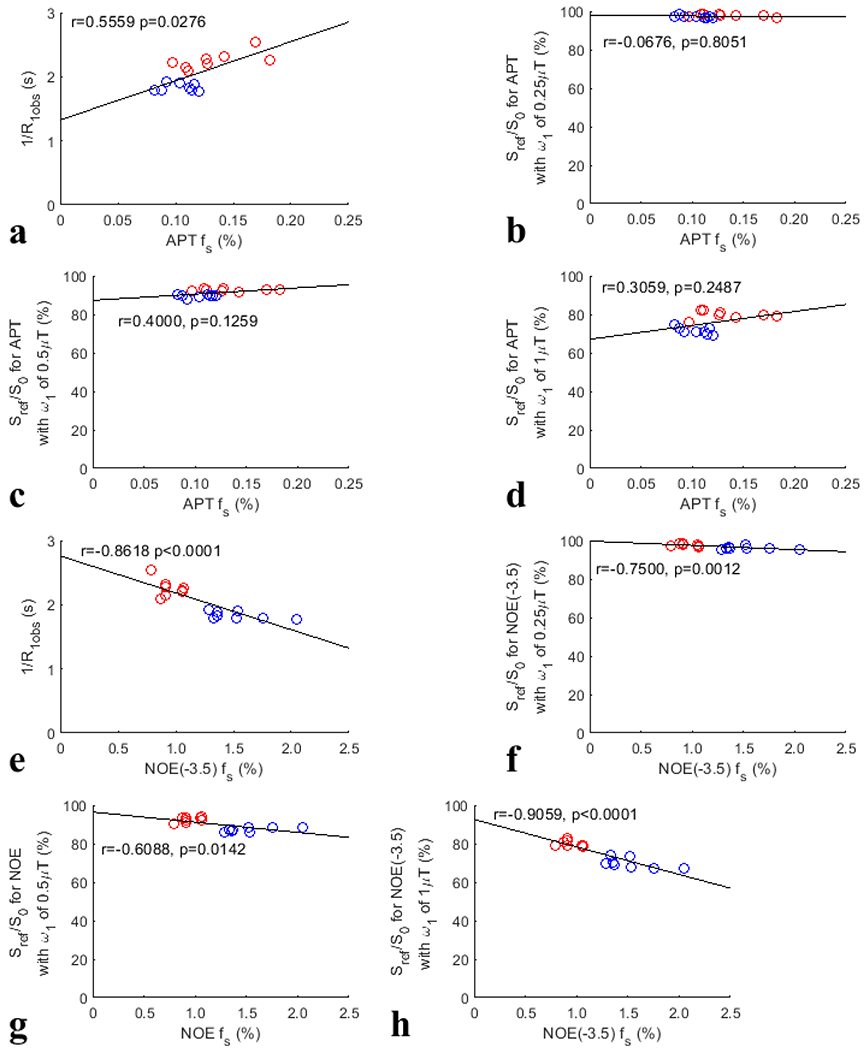
Fig. 9.

Summarized correlation of the confounding factors (1/R1obs, Sref/S0 with values of , , and ) with the APT fs (a-d) and NOE(−3.5) fs (e-h), respectively, from both the tumors and the contralateral normal tissues of the eight rats. The red circles represent the mean values of each tumor, and the blue circles are the mean values of each ROI of contralateral normal tissue. The Spearman’s rank correlation coefficient (r) and p value of each correlation are provided. The black lines represent the linear regression of all data points in each correlation subfigure.
