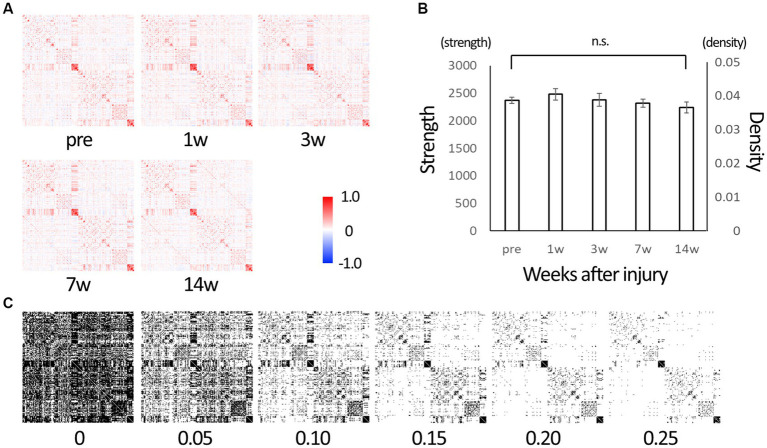
Figure 1.
The matrix representing edges between nodes of the whole brain. (A) Matrix representing edges (connections) between 244 nodes of the whole brain. Those are of before injury (“pre”), 1, 3, 7, and 14 weeks post-injury (wpi) states. The lower left and upper right are mirror images of each other. Each connection takes a value between −1 (strong negative correlation, blue) and 1 (strong positive correlation, red). (B) Strength is the sum of the connectivity of all edges, and density is the average value of the connectivities. After injury, strength tended to increase from the baseline (“pre”), indicating that the brain network is being reorganized, and it decreases over time, indicating the reorganization is settled down. (C) Serial data from −1 to 1 were converted to binary data (0 or 1) using various threshold values for use in network analysis. We used 0.10 as the threshold value in subsequent network analysis with reference to the density value (Error bars are shown in SEM for all figures. n.s.: no significant differences).

