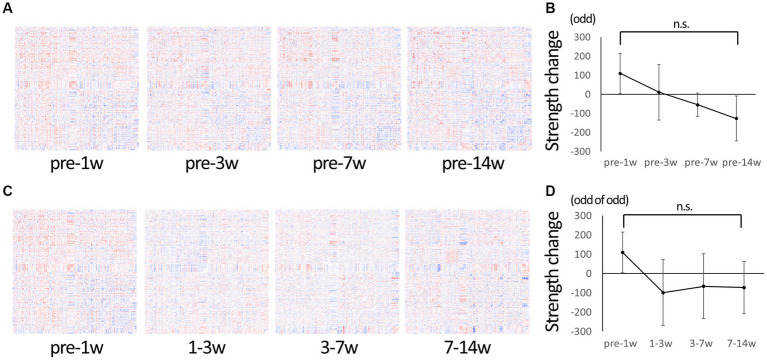
Figure 2.
Change in connectivity over time. (A) To observe the change of connectivities in detail, the difference from pre-injury (before injury) was calculated for the serial data and represented in matrices. Red indicates increased edges, and blue indicates decreased edges. Increased edges predominate at 1 wpi and decreasing edges predominate at 14 wpi. (B) A graph showing changes in strength compared to the pre-injury state. The strength tends to be higher than the pre-injury state at 1 wpi, and it gradually decreased to the lowest value at 14 wpi. (C) The difference from the previous time-point was calculated for the serial data and represented in matrices. (D) A graph showing the change in strength from the previous time point; it is negative (decreasing trend) at 3–7 wpi and 7–14 wpi, but not larger than the difference of 1–3 wpi, suggesting that the overall change is getting smaller over time (Error bars are shown in SEM for all figures. n.s.: no significant differences).

