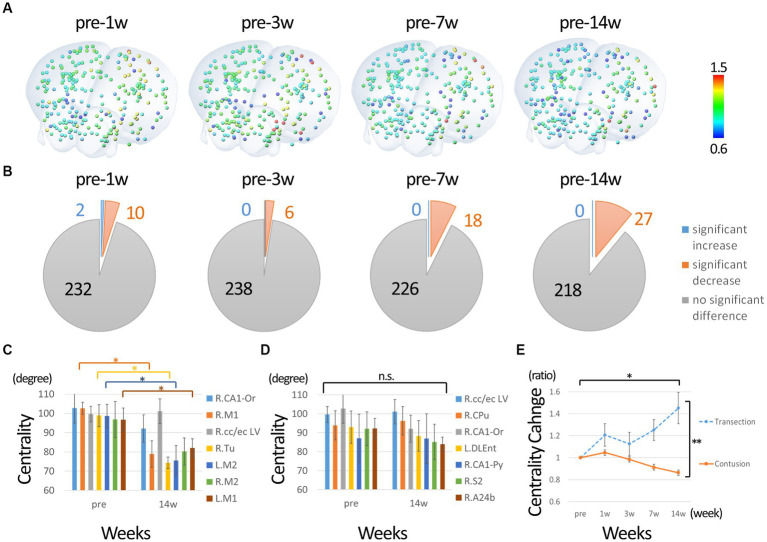
Figure 4.
Change in degree centrality of nodes of motor function. (A) The percentage change from before the injury was calculated. The nodes colored with ratios ranging from 0.6 to 1.5. (B) Shows the statistical results compared to pre-injury. In contrast to the overall analysis, many nodes show a significant decrease in centrality from 1w after injury, with few nodes showing an increase. (C) The change in nodes that had high centrality before injury. The highest centrality was seen in the primary and secondary motor cortices, which showed a predominant decrease at 14 weeks post-injury. (D) The changes in the nodes that showed high centrality at 14 weeks post-injury. The centrality of these nodes did not increase, but did not decrease, compared to pre-injury, suggesting that they took on a new main hub function in the overall decline. In particular, the centrality of the putamen and corpus callosum/external capsule was relatively high both before and after injury. Please refer to the Supplementary Figure 2 for all time points. (E) The changes in centrality of sensorimotor cortex in the completely injured model for comparison with the current incomplete injury. The nodes of sensorimotor region were analyzed instead of primary motor cortex because the position was slightly different in the Paxson and Allen atlases. Compared to pre-injury, the centrality of the sensorimotor cortex decreased in the incomplete injure model, whereas it increased in the complete injury model (R, right; L, left; CA1-Or, CA1 oriens; CA1-Py, CA1 pyramidale; M1, primary motor cortex; M2, secondary motor cortex; S2, secondary sensorimotor cortex; cc/ec, corpus callosum/external capsule; Tu, olfactory tubercle; Cpu, putamen; A24b, cingulate cortex area A24b; DLEnt, Dorsolateral entorhinal cortex. Error bars are shown in SEM for all figures. *p < 0.05, **p < 0.01).

