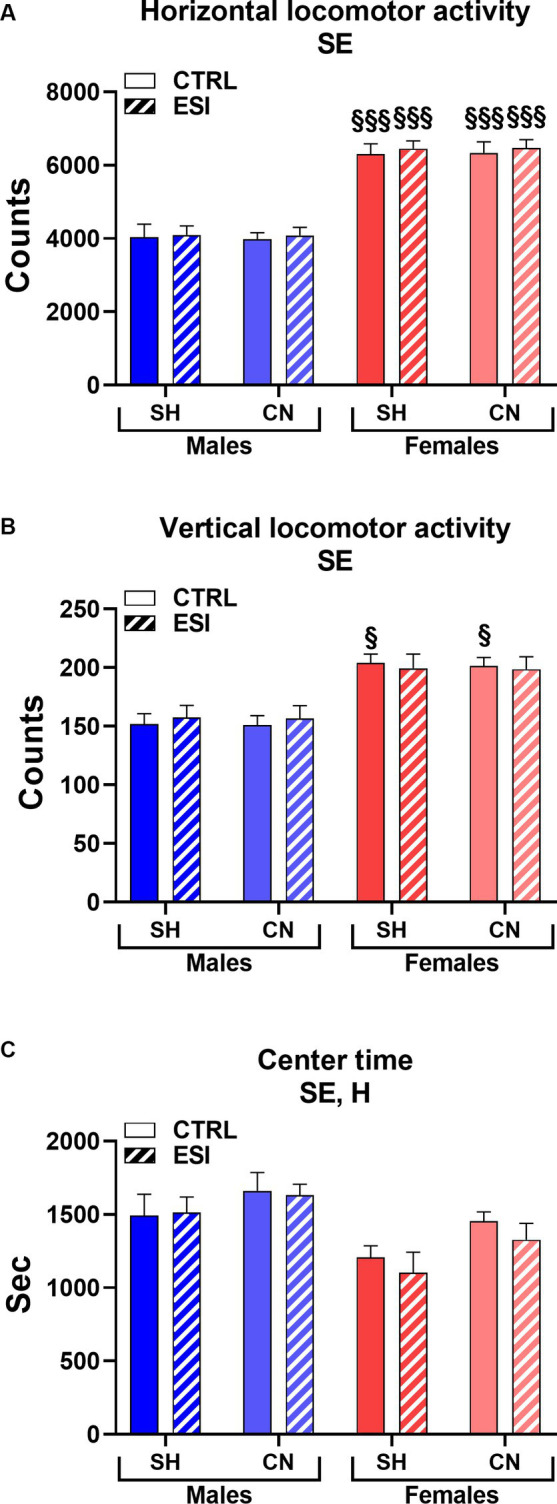
Figure 5.

Horizontal (A), vertical (B), and center (C) locomotor activity in adult male (blue) and female (red) rats. Data are expressed as means ± SEM of the total number of counts (A, B) and the total time spent in the central part of the arena (C). SH: standard housing, CN: communal nesting, CTRL, no stress, ESI, early social stress. Three-way ANOVA followed by Bonferroni’s pairwise comparisons (n = 8 rats/group). SE, significant effect of sex; H, significant effect of housing. §p < 0.05; §§§p < 0.001 vs. the respective male group.
