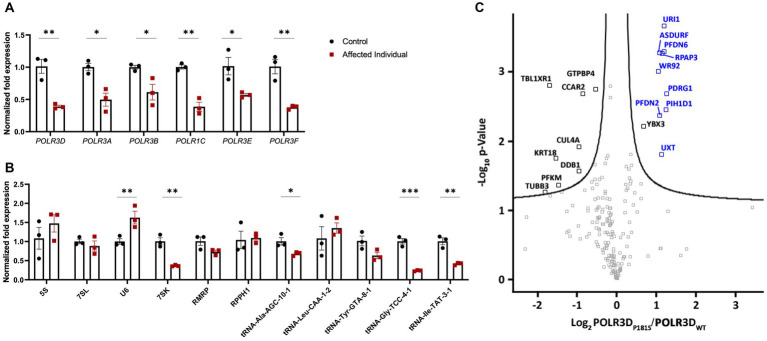
Figure 3.
Molecular and complex assembly level implications of pathogenic variants in POLR3D. (A) RT-qPCR analysis of RNA derived from patient-derived fibroblasts and an age- and sex-matched control (n = 3) demonstrating significantly decreased mRNA expression of all Pol III subunits analyzed (e.g., POLR3A, POLR3B, POLR1C, POLR3D, POLR3E, and POLR3F) in the affected individual. (B) RT-qPCR analysis of Pol III transcripts reveals a differential impact of biallelic pathogenic variants on Pol III transcription, including significantly increased expression of U6 RNA and significantly decreased expression of 7SK RNA, tRNA-Ala-GTA-8-1, tRNA-Gly-TCC-4-1, and tRNA-Ile-TAT-3-1 and a trend toward a decrease in tRNA-Tyr-GTA-8-1. RT-qPCR data represent mean ± SEM normalized fold expression after normalizing to reference genes TFRC and PGK1. *p < 0.05, **p < 0.01, ***p < 0.001, two-sided Student’s t-test. (C) Volcano plot illustrating the log2 ratio between POLR3D p.P181S and POLR3D WT proteins (n = 3). PAQosome subunits are marked in blue and all other proteins that cleared the False Discovery Rate (FDR) threshold of 0.05 are marked in black.

