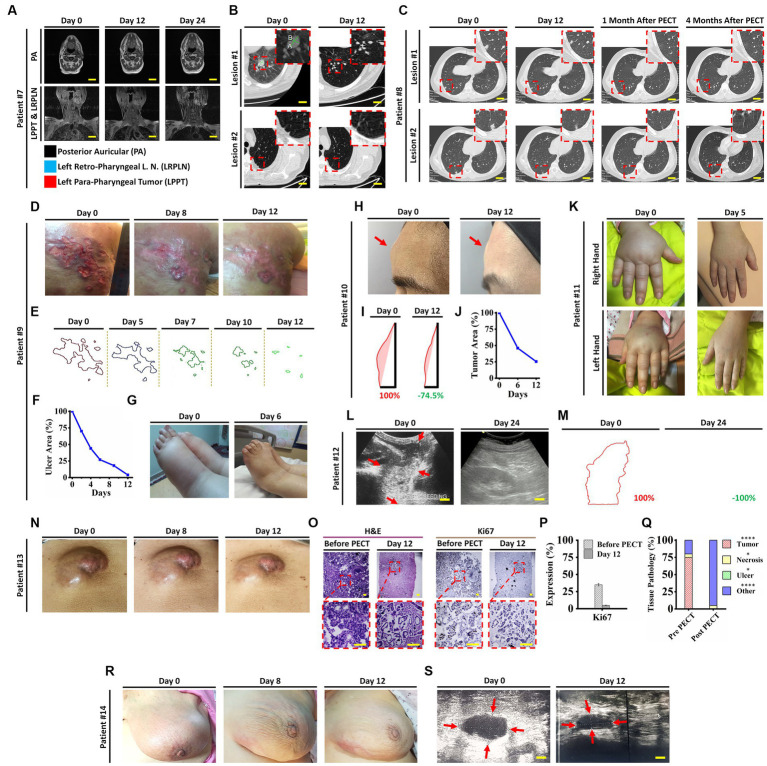
Figure 5.
(A) Head and neck MRI images of patient ID#7 from beginning to end of the PECT. (B) Spiral chest CT scan of patient ID#7 before and after PECT. Inset images demonstrate magnified views of targeted lesions at the left lung lower lobe (Supplementary Movie S1). (C) Spiral chest CT scan of patient ID#8 from beginning to end, 1 and 4 months after the PECT. Inset images depict magnified views of targeted lesions at the right lung lower lobe. Obviously, the mentioned lesions were completely degraded, and there was no sign of recurrence after 4 months. Patient ID#9, DCIS patient with 10 years history of unsuccessful therapies with severe symptoms, such as extensive right upper back skin metastasis, left breast triple-negative carcinoma, and metastatic lymph nodes with severe induced lymphedema. (D) Optical images of the exposed skin metastasis at the right upper back before, during, and at the end of the PECT. The patient bore severe pain due to an extensive cancer-associated skin ulcer. At the beginning of PECT, the patient’s pain expression drastically decreased, and after 5 days, she stopped using tranquilizers. (E,F) Image processing of the cancer-associated skin ulcer from beginning to end of the PECT. Calculations showed a significant reduction of cancerous areas, about~90%. (G) The lower limbs’ edema improved significantly, from 4+ pitting edema to 1+, after 6 days of PECT (Supplementary Movie S2). (H) Optical images of the forehead tumor of the patient ID#10. (I,J) Image processing of the patient’s forehead tumor showed a ~ 75% reduction in size. (K) Optical images of the patient ID#11 edematous upper limbs. A significant decrease of mentioned edema occurred after 5 days of PECT. (L) Ultrasonography (US) of the epigastric tumor of the patient ID#12. The US showed complete destruction of epigastric tumor after PECT. Scale bars, 1 cm. (M) Image processing analysis showed the margins of the epigastric tumor, which completely vanished by PECT. (N) optical images of abdominal wall tumor size reduction in patient ID#13. (O) H&E and Ki67 immunostaining of the tumor section before and after PECT. Pyknotic nuclei and low density of cancerous cells showed the effect of PECT in both H&E and Ki67 staining. Scale bars, 20 μm. (P,Q) Comparative graphs depicted Ki67 expression and pathological tissue components of the tumor section before and after the PECT. The mean of 10 different slides determined the percentage of each component from one biopsied tumor (****p < 0.0001, *p > 0.05, Paired T-test). (R) Images of patient ID#14 with a significant reduction of tumor size located in the left breast. (S) Left breast ultrasonography images showed a remarkable reduction of left inner quadrant edema, upper outer quadrant edema, and 7 O’clock tumor.

