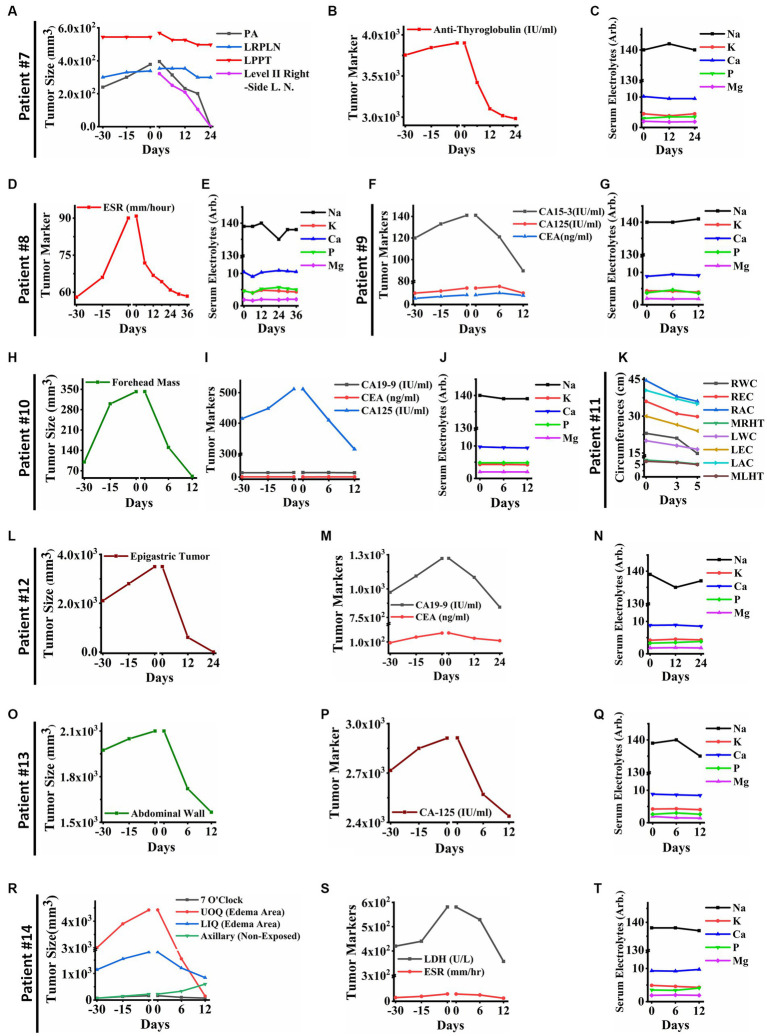
Figure 6.
(A) Tumor sizes of patient ID#7 from 30 days before PECT and during PECT. Posterior auricular tumor (PA) and lymph node in level II have vanished completely in the right side of the neck. Moreover, Left Retropharyngeal Lymph Node (LRPLN) and Left Parapharyngeal Tumor (LPPT) decreased in size. (B) Anti-Thyroglobulin of patient ID#7, as a cancer-associated antigen, decreased significantly while it was increasing before PECT. (C) Serum electrolytes of patient ID#7. They did not show significant changes during PECT. (D) The cancer-associated antigen of patient ID#8. The Erythrocyte Sedimentation Rate (ESR) of patient ID#8 decreased significantly and reached the normal range. (E) Serum electrolytes of the patient ID#8. They were within the normal range during PECT. (F) Cancer-associated antigens of patient ID#9. They showed an upward trend before PECT, while they started to decline after electrostatic charge therapy began. (G) Serum electrolytes of the patient ID#9. (H) Tumor size of the patient ID#10. Forehead mass, which was measured with a caliper, was increasing before the start of the PECT. Although, it showed a significant reduction in size after PECT. (I) Cancer-associated antigens of patient ID#10 were demonstrated 30 days before and during PECT. (J) Serum electrolytes of the patient ID#10. They did not change significantly during PECT. (K) The clinical parameters of the patient ID#11 were measured as follows: Right Wrist Circumference (RWC), Right Elbow Circumference (REC), Right Arm Circumference (RAM), Maximum Right-Hand Thickness (MRHT), Left Wrist Circumference (RWC), Left Elbow Circumference (REC), Left Arm Circumference (RAM), and Maximum Left-Hand Thickness (MRHT). They decreased in size during PECT. (L) The size of the epigastric tumor of the patient ID#12. It has entirely vanished after PECT. (M) Cancer-associated antigens of the patient ID#12. There was an increasing trend before the PECT, while they started to decrease after the beginning of the PECT. (N) Serum electrolytes of the patient ID#12 during PECT. (O) The size of the tumor in the abdominal wall of patient #13. It showed a significant size reduction. (P) Cancer-associated antigen in patient ID#13. It decreased drastically, while it was increasing before PECT. (Q) Serum electrolytes of the patient ID#13. They were stable during PECT. (R) Tumor sizes of the patient ID#14. The axillary tumor, which was not exposed to PECT, increased in size. The other tumor sizes decreased. (S) Cancer-associated antigens of patient ID#14. They have been significantly reduced during PECT. (T) Serum electrolytes of the patient ID#14. They did not change significantly during PECT. The reference intervals of serum biomarkers and blood biochemistry factors are presented in Supplementary Table 3.

