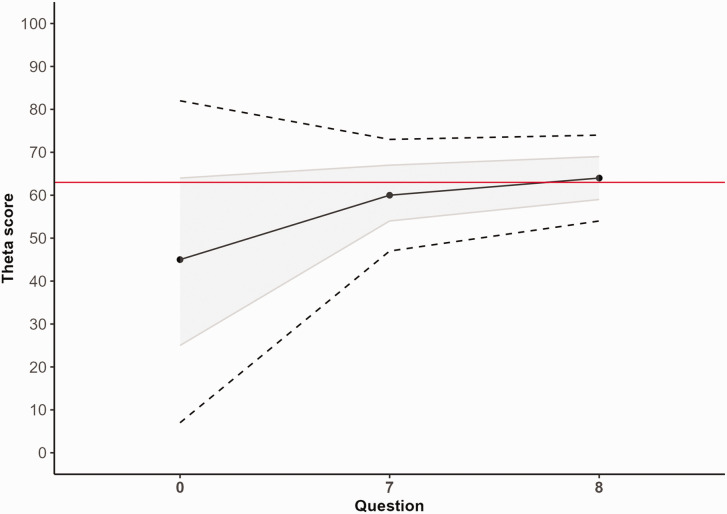
Figure 1.
Example of the change in theta score (range 0–100) estimation in a patient during the computerized adaptive test (CAT). The red line represents the full-length score (63) if this patient would have filled in all 10 questions. Before the patient has answered any questions, the score starts at the population's average of 45. After completing the first question (PEM question 7), the score adjusts to 60 with a decreasing SEm. After the second question (PEM question 8), the score is 64 after which the CAT stops as the SEm has become smaller than 0.3. The grey area reflects the mean SD SEm, and the dashed lines represent SD 0.96 × SEm (95% confidence interval).

