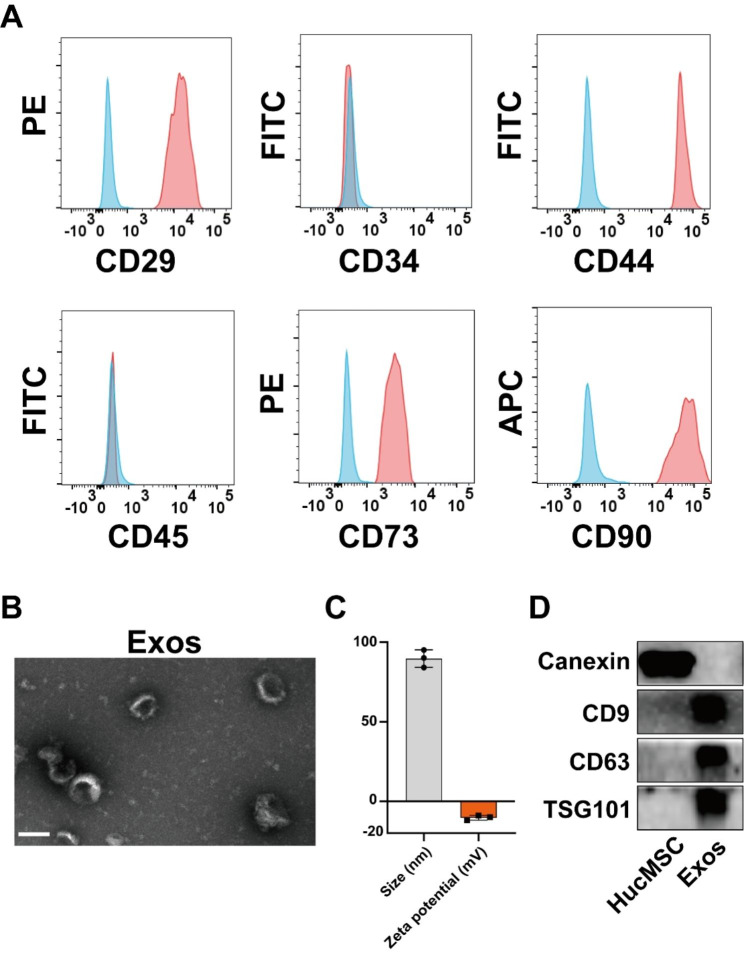
Fig. 1.
Extraction and characterization of exosomes from human umbilical cord mesenchymal stem cells. (A) Flow cytometry analysis of the typical surface markers in HucMSCs. Blue curves: the isotype controls; Red curves: the test samples. (B) TEM images of Exos. Scale bar, 100 nm. (C) Size distribution (PDI = 0.14) and zeta potential of Exos were measured by dynamic light scattering (n = 3). (D) Typical surface markers expressed on HucMSCs and Exos were determined by Western blot analysis (Calnexin: 90 kDa, CD9: 25 kDa, CD63: 26 kDa, TSG101: 45 kDa)

