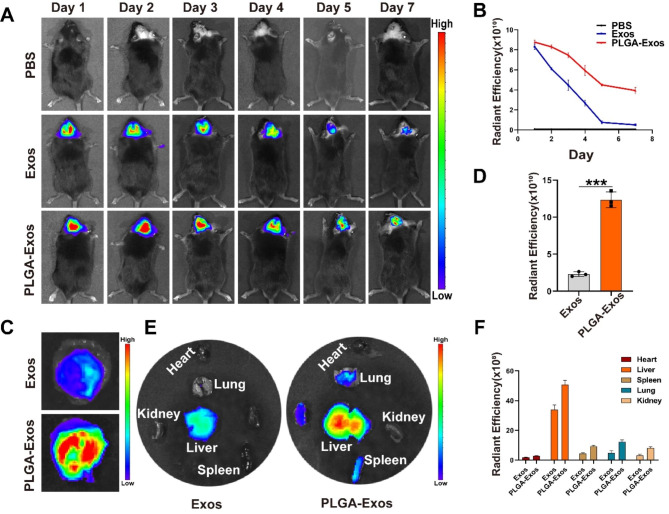
Fig. 5.
Biodistribution of PLGA-Exos in mice with PE particles-induced mouse calvarial osteolysis. (A, B) Representative fluorescence images after local injections of DiR-labeled Exos (200 µg) and PLGA-Exos (200 µg), and quantification of the fluorescent intensity. (C, D) Representative IVIS images showed the distribution of the calvarial region of the mouse and the quantification of the fluorescent intensity. (n = 3 samples per group, t-test, *P < 0.05, ** P < 0.01, *** P < 0.001) (E, F) Representative IVIS images showed the distribution of Exos and PLGA-Exos in the main organs after PE particle-induced calvarial osteolysis. (n = 3 samples per group, *P < 0.05, ** P < 0.01, *** P < 0.001)

