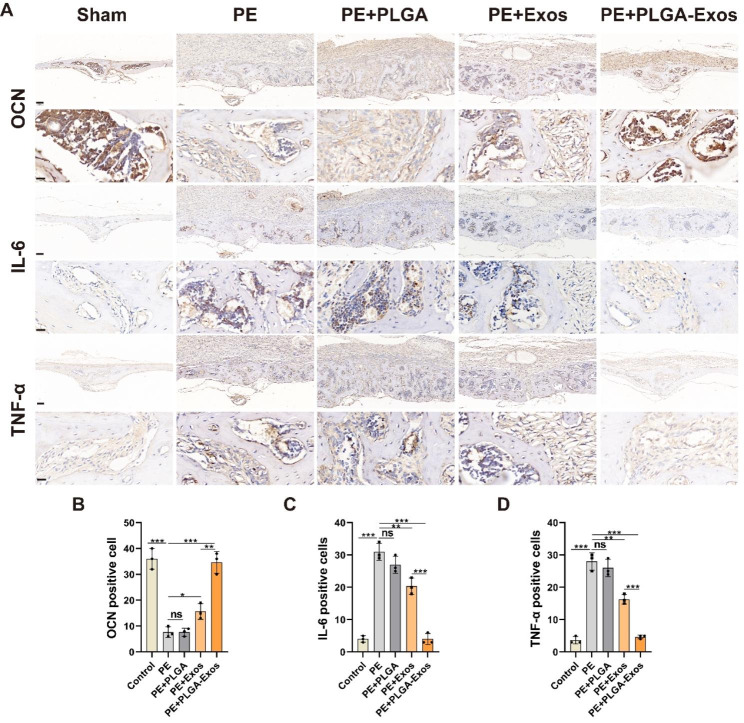
Fig. 8.
Immunohistochemical staining and quantitative analysis of OCN, IL-6, and TNF-α in mouse calvaria of each group. (A, B) Representative images of OCN staining and percentage of OCN positive cells (n = 3). Scale bar, 100 μm (above), 16 μm (below) (A, C) Representative images of IL-6 staining and percentage of IL-6 positive cells (n = 3). Scale bar, 100 µ m (above), 16 µ m (below) (A, D) Representative images of TNF-α staining and percentage of TNF-α positive cells (n = 3). Scale bar, 100 µ m (above), 16 µ m (below). (n = 3 samples per group, ANOVA, *P < 0.05, ** P < 0.01, *** P < 0.001)

