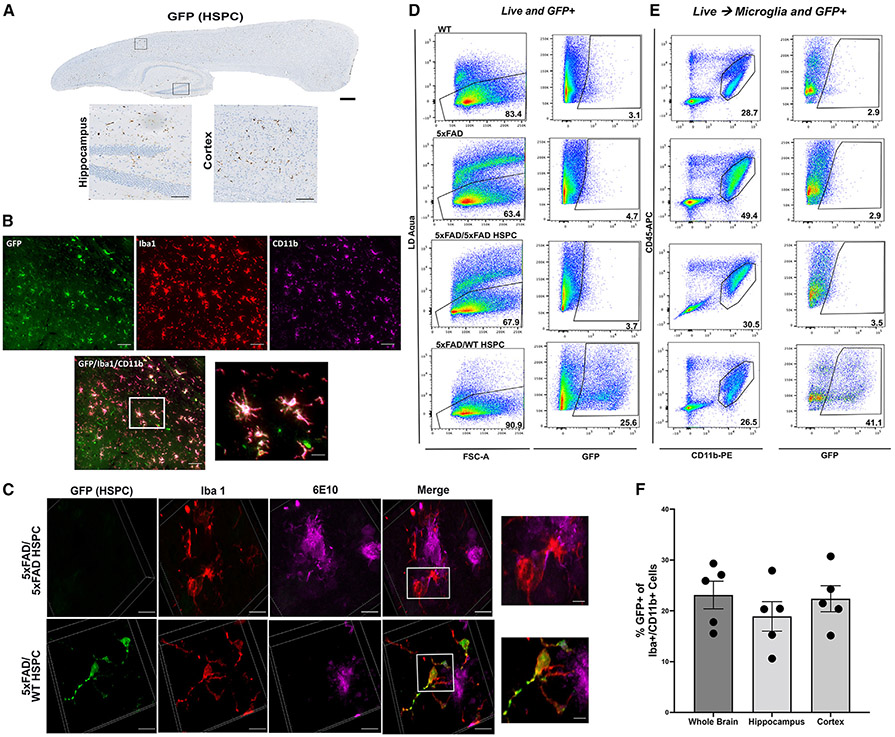
Figure 3. Infiltration of transplanted GFP+ WT HSPCs into the brain of 5xFAD mice and differentiation into microglia-like cells.
(A) Representative immunohistochemistry image of a sagittal section of the brain from 5xFAD/WT HSPC mice at 4 months post-transplantation showing GFP+ cells; insets show GFP+ cells in hippocampus and cortex. Scale bars, 500 μm (whole brain) and 100 μm (insets).
(B) Representative immunofluorescent image of the brain showing engrafted GFP+ HSPC-derived cells (green) and anti-Iba1 (red) and anti-Cd11b (magenta) antibodies. Scale bars, 100 μm. Inset showing HSCP-derived microglia-like cells. Scale bar, 20 μm (inset).
(C) Representative 3D reconstitution of immunofluorescence image of brain sections from 5xFAD/5xFAD HSPC (top panel) and 5xFAD/WT HSPC mice (bottom panel) stained with anti-GFP (green), anti-Iba1 (red), and anti-6E10 (magenta) antibodies. Scale bars, 10 μm. The top inset shows inflamed active Iba1+ in close proximity to 6E10+ plaques of 5xFAD/5xFAD HSPC mice. The bottom inset shows ramified GFP+ Iba1+ microglia around 6E10+ plaques of 5xFAD/WT HSPC mice. Scale bar, 2 μm.
(D) Flow cytometry plots of live and GFP+ cells in the whole brain of WT, 5xFAD, 5xFAD/5xFAD HSPC, and 5xFAD/WT HSPC mice. Brain cells were labeled with Zombie Aqua for live-/dead-cell populations.
(E) Flow cytometry of microglia (CD45+ CD11bhigh) and of GFP+ microglia in 5xFAD/WT HSPC mice.
(F) Percentage of Iba1+ Cd11b+ microglia derived from the GFP+ HSPCs quantified in the whole brain, hippocampus, and cortex. Each dot represents individual samples.

