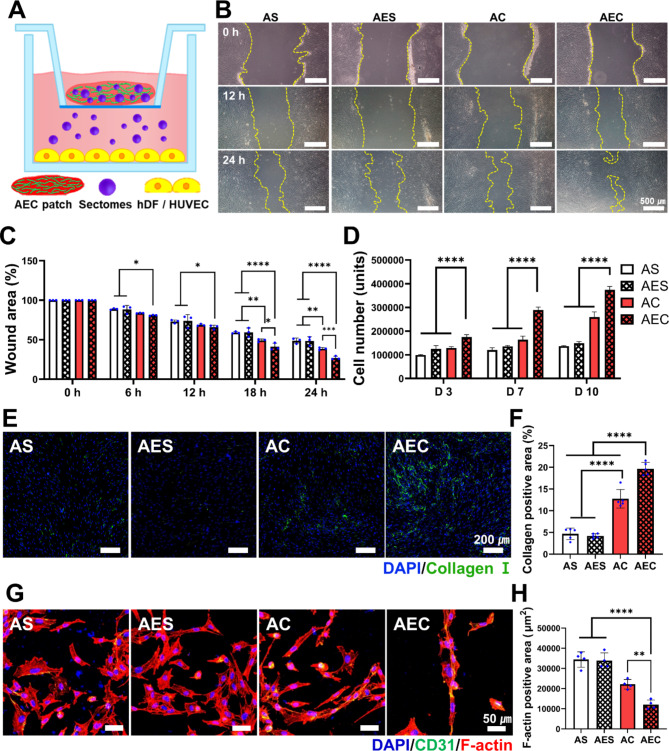
Fig. 3.
Assessment of biological activity of AEC patch in vitro. (A) Schematic of AEC patch-contained secretomes transport to the cells using a transwell setting. (B) Gross observation of hSFB scratch wound closure with time. The yellow line indicates the uncovered wound area with the cells. Scale bar is 500 μm. (C) Quantification of the wound closure rate at different time points for 24 h. (D) Cell proliferation of hSFB when treated with each patch group as measured by CCK-8 assay for up to 10 days. (E) Immunofluorescence staining of collagen type I (green) as synthesized by hSFB, along with DAPI staining (blue). (F) Quantification of collagen I positive area. (G) Immunofluorescence staining of HUVEC (blue: DAPI, green: CD31, red: F-actin). (H) Quantitative analysis of positively stained area of F-actin. Statistically significant difference (*p < 0.05, **p < 0.01, ***p < 0.001, ****p < 0.0001)

