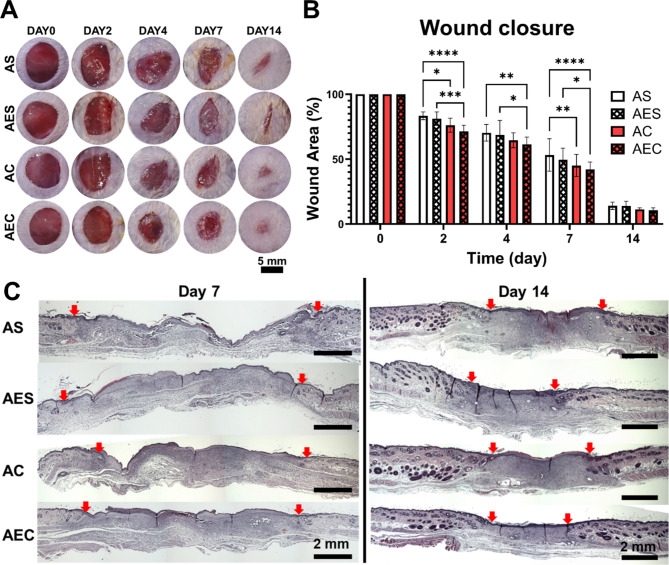
Fig. 4.
Observation of wound closure and histological analysis of wound tissues via. (A) Representative images of full-thickness skin wounds as administered by four different patch groups (AS, AES, AC, and AEC) at 0, 2, 4, 7, and 14 day post-treatment. Scale bar is 8 mm. (B) quantitative measurement of wound closure rate (%) for up to 14 days. (C) Representative images of regenerated wound tissues for each patch group on day 7 and 14 as stained by H&E. Red arrows indicate the wound edges. Scale bar is 2 mm. Statistically significant difference (*p < 0.05, **p < 0.01, ***p < 0.001, ****p < 0.0001)

