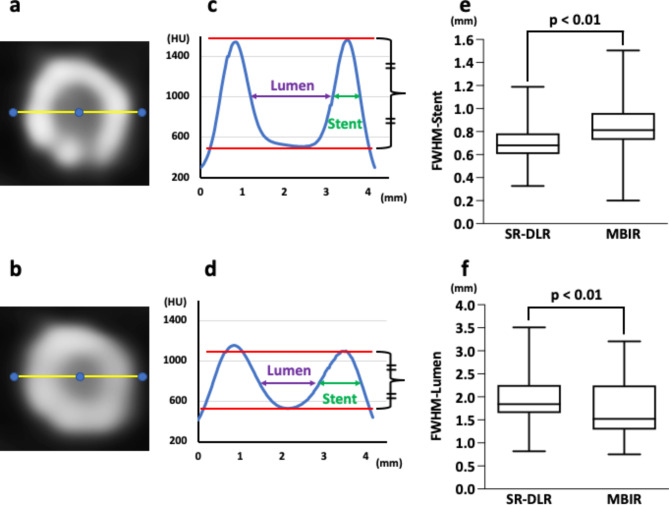
Fig. 2.
Quantitative analysis of the lumen and stent in the coronary artery. After identifying the center of the stent on a cross-sectional image, attenuation profiles were calculated (a: SR-DLR, b: MBIR). FWHM-lumen and FWHM-stent were measured (c: SR-DLR, d: MBIR). FWHM-stent was significantly thinner (p < 0.01), whereas FWHM-lumen was significantly larger on SR-DLR (p < 0.01) than on MBIR (e, f). SR-DLR, super-resolution deep learning reconstruction; MBIR, model-based iterative reconstruction; FWHM-lumen, full width at half maximum of the lumen; FWHM-stent, full width at half maximum of the stent

