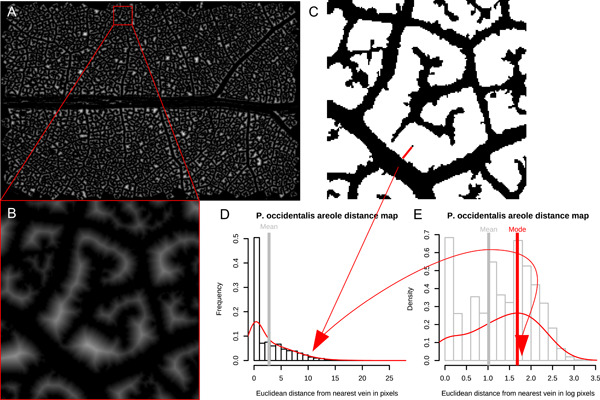
Figure 4.

Vein density measurements using distance maps. (A) The ROI shown in Figure 2B after applying a distance map; the lighter shades indicate pixels farthest from the nearest vein. (B) An expanded view of the same areole shown in Figures 2 and 3. (C) Another view of the expanded area, showing the value given by the distance transform for the same pixel identified in Figure 3C. (D) The distribution of distances for all foreground pixels in the ROI. (E) Log‐transform of the histogram and density shown in (C), again with the location of the same pixel in the distribution identified.
