Figure.

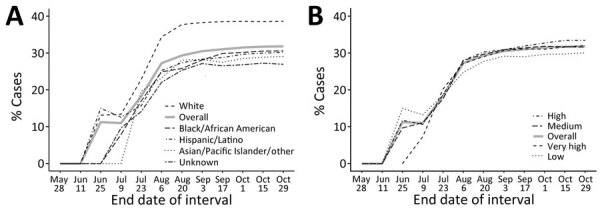
Comparisons of cumulative percentages of persons with mpox treated with tecovirimat during 2-week intervals in study of racial and socioeconomic equity of tecovirimat treatment during 2022 mpox emergency, New York City, New York, USA. Percentages of mpox cases diagnosed during May 19–October 29, 2022, are indicated. Treated persons who had no prescription date (n = 22) were not counted. A) Percentages according to race/ethnicity. B) Percentages according to neighborhood poverty level, defined as: low poverty, <10% of neighborhood population; medium, 10%–19.9%; high, 20%–29.9%; and very high, >30%.
