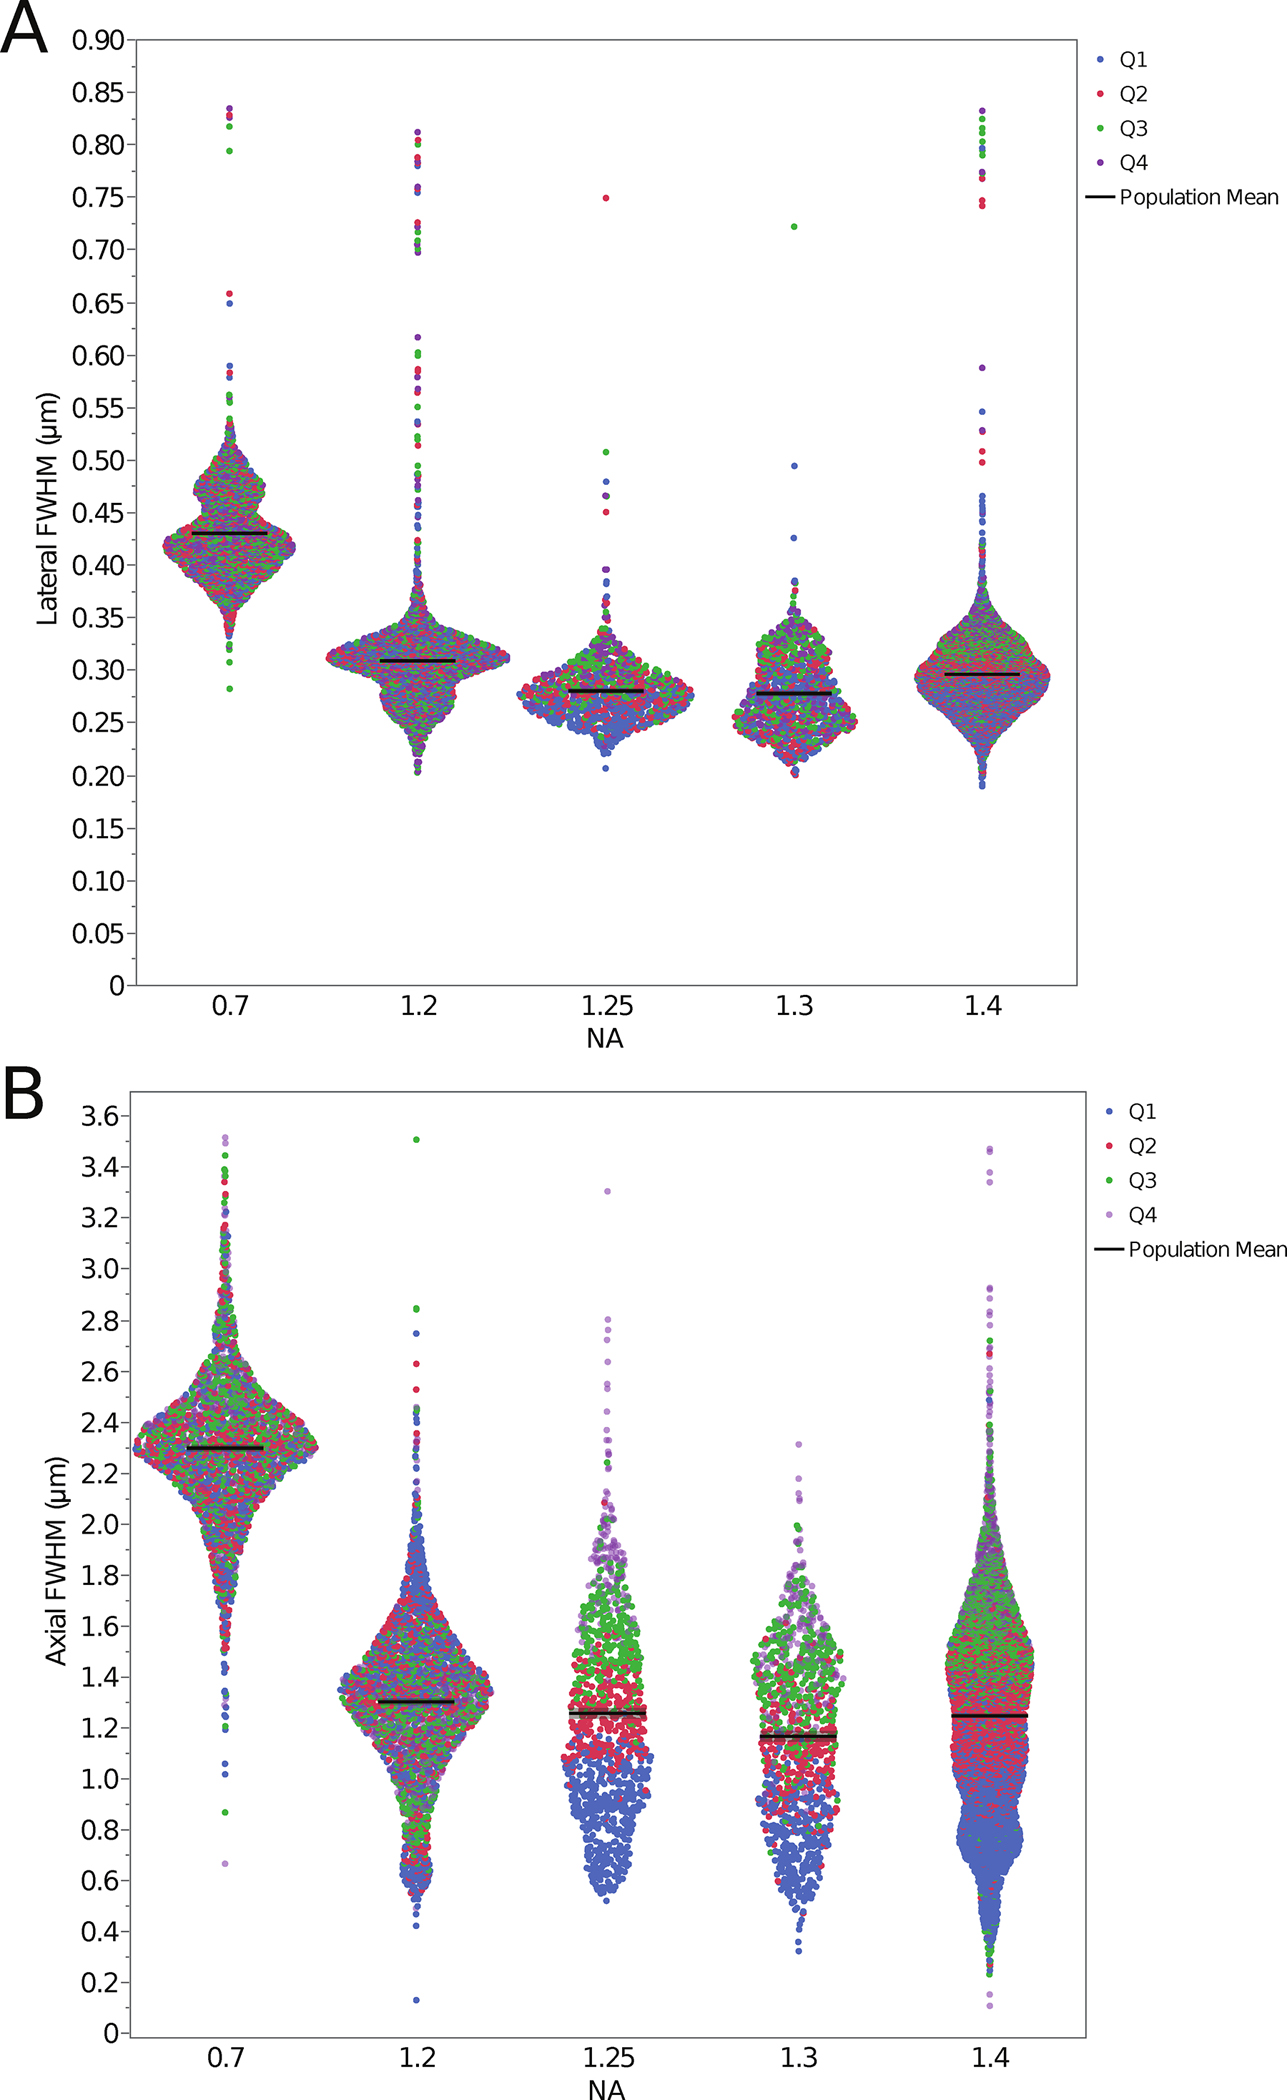
Figure 3. Lateral and axial resolution of the PSFs for data from microspheres at all sample depths as a function of the objective lens NA.

Datapoints are plotted for each individual microsphere and color coded by depth quadrant for the lateral FWHMxy (A) and axial FWHMz (B) PSF FWHM resolution. The distribution of the data is displayed as a violin plot with the data organized into groups based on objective lens NA. The increase in the axial PSF FWHM as a function of depth into the sample is evident for the high NA lenses. The black lines mark the bulk population mean values. Summary data is also listed in Table 1 (bottom) along with standard deviations for these measurements.
