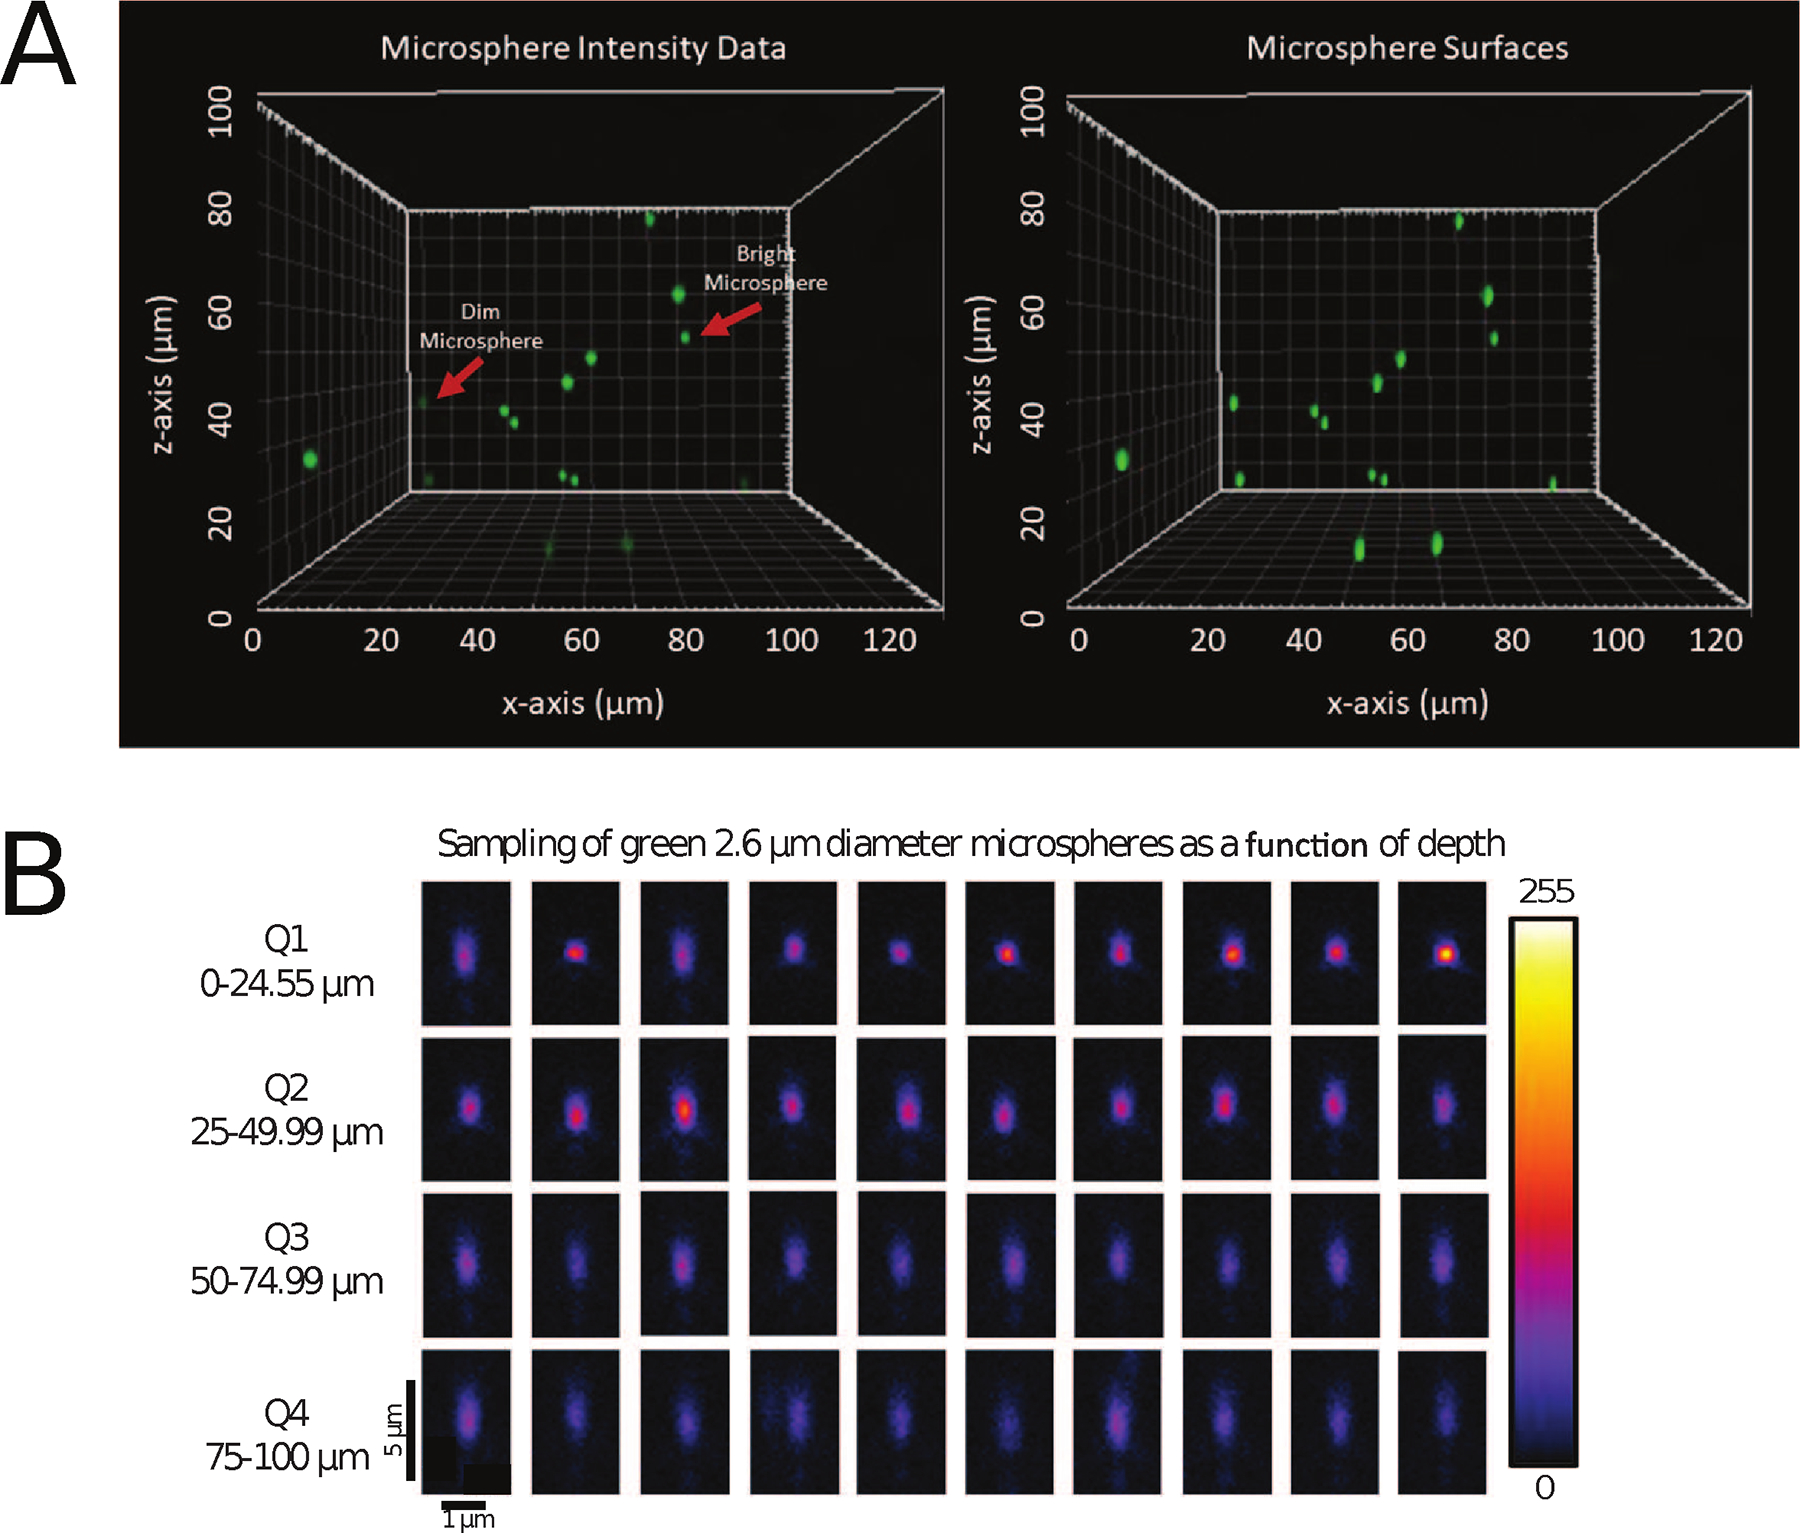
Figure 5. Representative images of 2.6 μm diameter green microspheres as a function of depth.

Screen shot from Imaris showing raw intensity (left panel) and Imaris spots surfaces (right panel) for bright (35%) and dim (3.7%) 2.6 μm diameter green microspheres within a 100 μm thick sample of CyGel™ from the xz-axis perspective (A). Spot statistics were measured for every microsphere and exported to an Excel file for further analysis. Representative images of the xz-plane through many different bright green microspheres from different depth quadrants in the 100 μm thick 3D CyGel™ sample showing the axial PSF (B). Quadrant 1 (Q1) closest to the coverslip: 0–24.99 μm, Quadrant 2 (Q2): 25–49.99 μm, Quadrant 3 (Q3): 50–74.99 μm and Quadrant 4 (Q4):75–100 μm. Note the loss of intensity with depth and the elongation of the PSF due to spherical aberrations. Data was collected with a 63x/1/4 NA oil immersion objective lens on a Zeiss LSM800. The 8-bit intensity scale is indicated on the right side.
