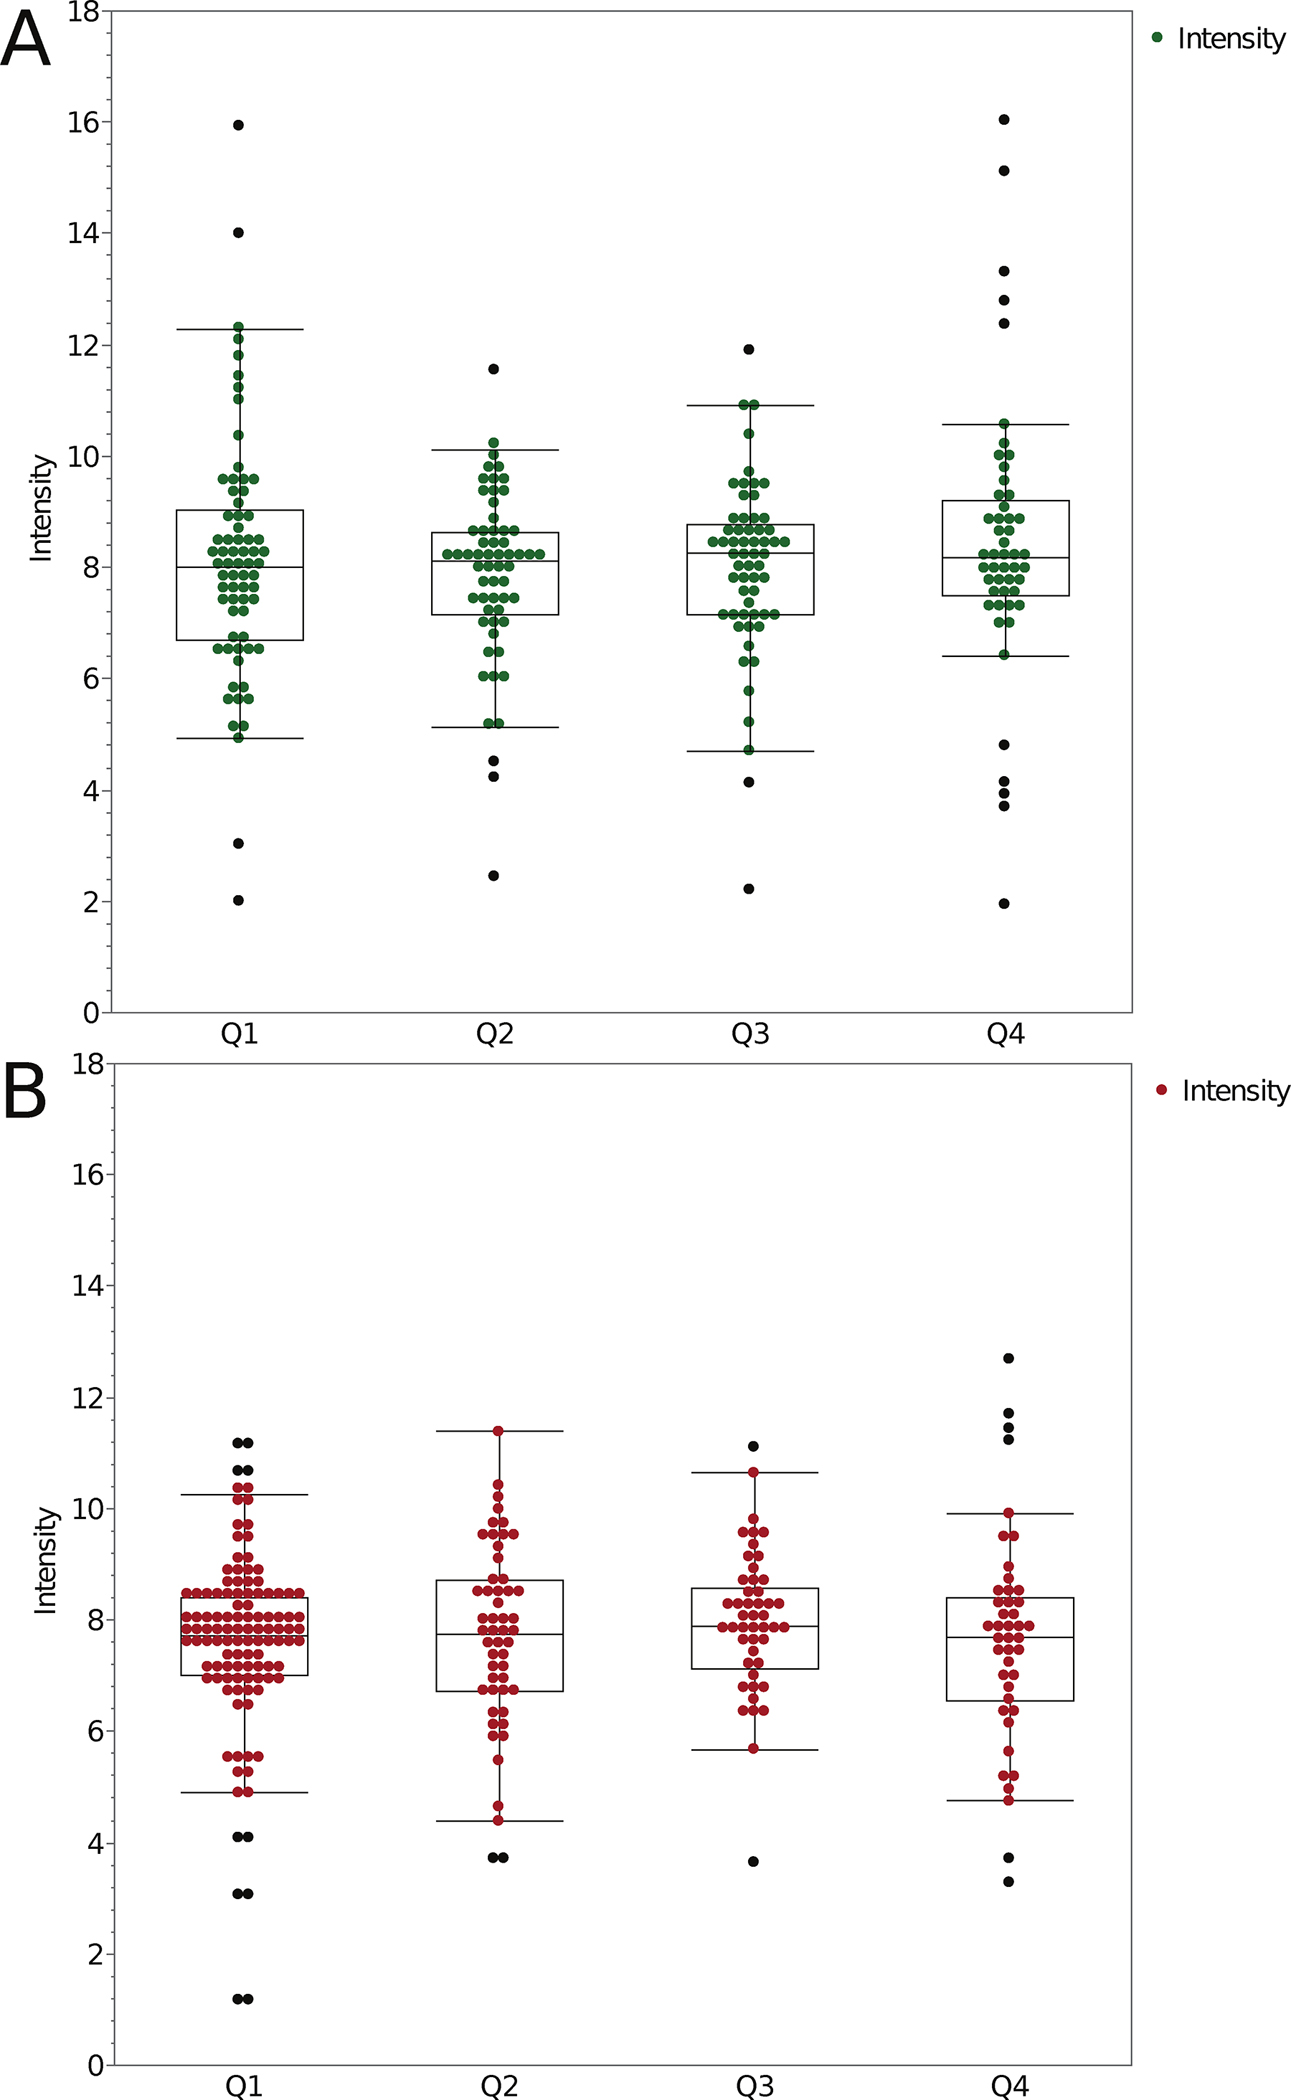
Figure 7. Bright over dim fluorescence intensity ratios for green and red fluorescent microspheres as a function of depth.

Fluorescence intensity ratios (Bright/Dim) for 2.6 μm diameter green microspheres (A) and 2.7 μm diameter red microspheres (B) as a function of depth in the 3D CyGel™ sample. Data is a compilation of 100 datasets, collected on 47 different CLSMs. Objective lens magnification ranged from 20x to 63x and NA from 0.7 to 1.4. The depth quadrants and Boxplot parameters are as in Figure 2 caption. Spots show outliers. The n values are the number of ratios measured and n = 237 measurements for the green ratio data. n = 254 measurements for the red ratio data.
