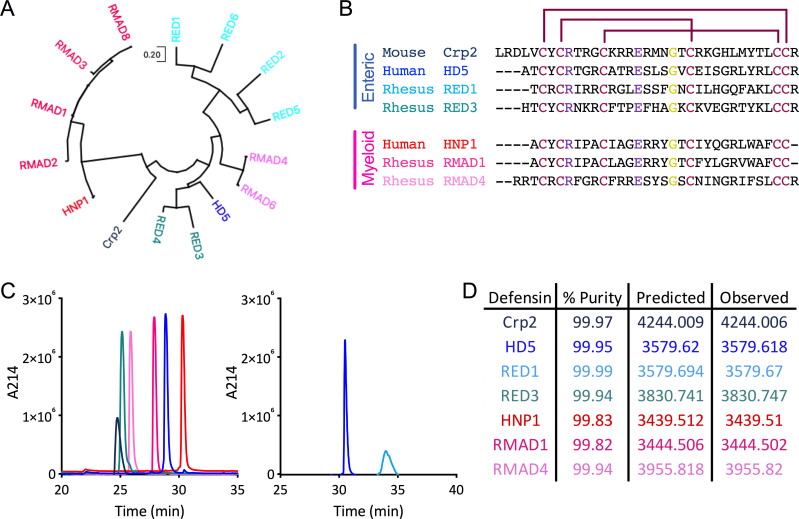
Fig 1.
Defensin refolding, sequences, and evolutionary relationships. (A) Dendrogram of mature protein sequences of rhesus enteric and myeloid α-defensins, one mouse enteric α-defensin (Crp2), and one each of the human enteric (HD5) and myeloid (HNP1) α-defensins. The evolutionary history was inferred by using the Maximum Likelihood method and JTT matrix-based model (29). The tree with the highest log likelihood is shown. Initial tree(s) for the heuristic search were obtained automatically by applying Neighbor-Join and BioNJ algorithms to a matrix of pairwise distances estimated using the JTT model and then selecting the topology with superior log likelihood value. The tree is drawn to scale, with branch lengths measured in the number of substitutions per site. Evolutionary analyses were conducted in MEGA X (30). (B) Amino acid sequence alignment of the mature α-defensin peptides used in this study. Enteric α-defensin names are written in shades of blue, while myeloid α-defensin names are written in shades of pink. Disulfide bond linkages are indicated by maroon lines. Residues that interact through a conserved salt bridge are colored purple, and the conserved glycine is colored yellow. Dashes represent gaps. For (A and B), accession numbers for defensin protein sequences are NP_066290 (HD5), P59665 (HNP1), AAW51365 (RED1), AAW51366 (RED2), AAW51367 (RED3), AAW51368 (RED4), AAW51369 (RED5), AAW51370 (RED6), AAF06312 (RMAD1), P82317 (RMAD2), AAF06313 (RMAD3), AAF06315 (RMAD4), AAF06316 (RMAD6), AAF06314 (RMAD8), and AAI25549 (Crp2). (C) Peptide samples were analyzed individually by RP-HPLC on a C18 column. Peaks are colored as in (B). Peptides depicted on the same graph were analyzed sequentially on the same day. (D) Percent purity determined by the analyses in (C) as well as predicted and observed molecular masses determined by electrospray ionization are listed for each defensin.

