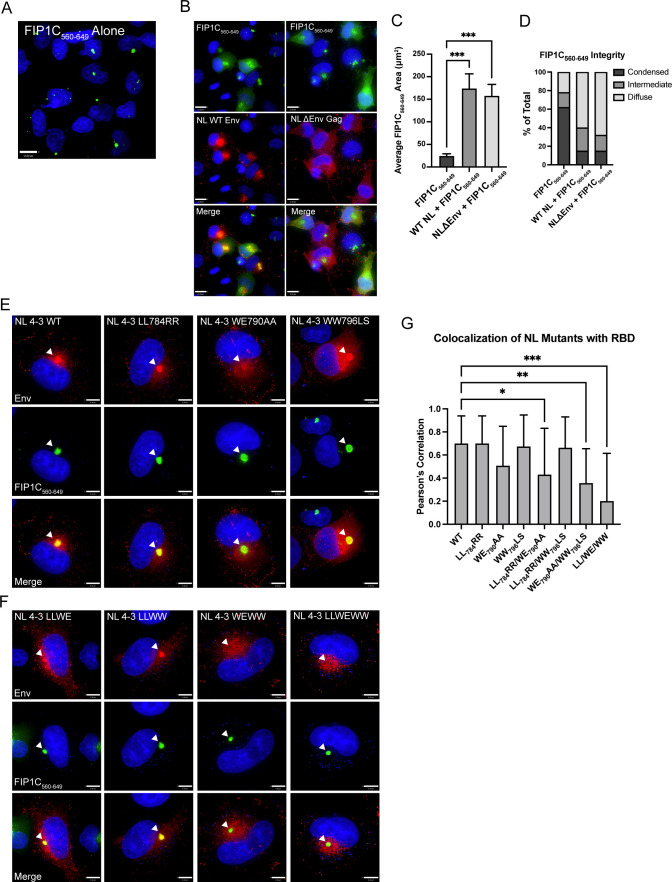
FIG 5.
NL4-3 disrupts the condensed ERC; evaluation of mutations that disrupt Env colocalization with the ERC in a proviral context. (A) Distribution of GFP-FIP1C560–649 alone. (B) Distribution of FIP1C560–649 with either NL4-3 WT or NL4-3 ΔEnv. Cells were fixed at 48 h post transfection, stained for Env (NL WT) or Gag (NL4-3 ΔEnv), and imaged. (C) GFP-FIP1C560–649-expressing cells from A or infected HeLa cells from B were defined as a region of interest (ROI), and the area of GFP-FIP1C560–649 was quantified within those ROIs. The results of area calculations are reported for 50 cells. (D) Cells from C were ranked based on the shape of the GFP-FIP1C560–649 compartment, with results reported as either condensed, intermediate, or diffuse. (E) Representative images from colocalization studies of individual point mutants in HeLa cells coexpressing the NL4-3 provirus and GFP-FIP1C560–649. (F) Distribution of NL4-3 Env bearing two combined mutations or all three point mutations from the LLP2/LLP3 junction in cells coexpressing GFP-FIP1C560–649. Arrowheads emphasize Env in the ERC. (G) Quantification of colocalization of NL4-3 Env with GFP-FIP1C560–649. Results are reported as the mean ± SD of Pearson’s correlation coefficient for 20 cells per condition. Results were analyzed by one-way analysis of variance with Dunnett’s correction. *, P < 0.05; **, P < 0.01; ***, P < 0.001.

