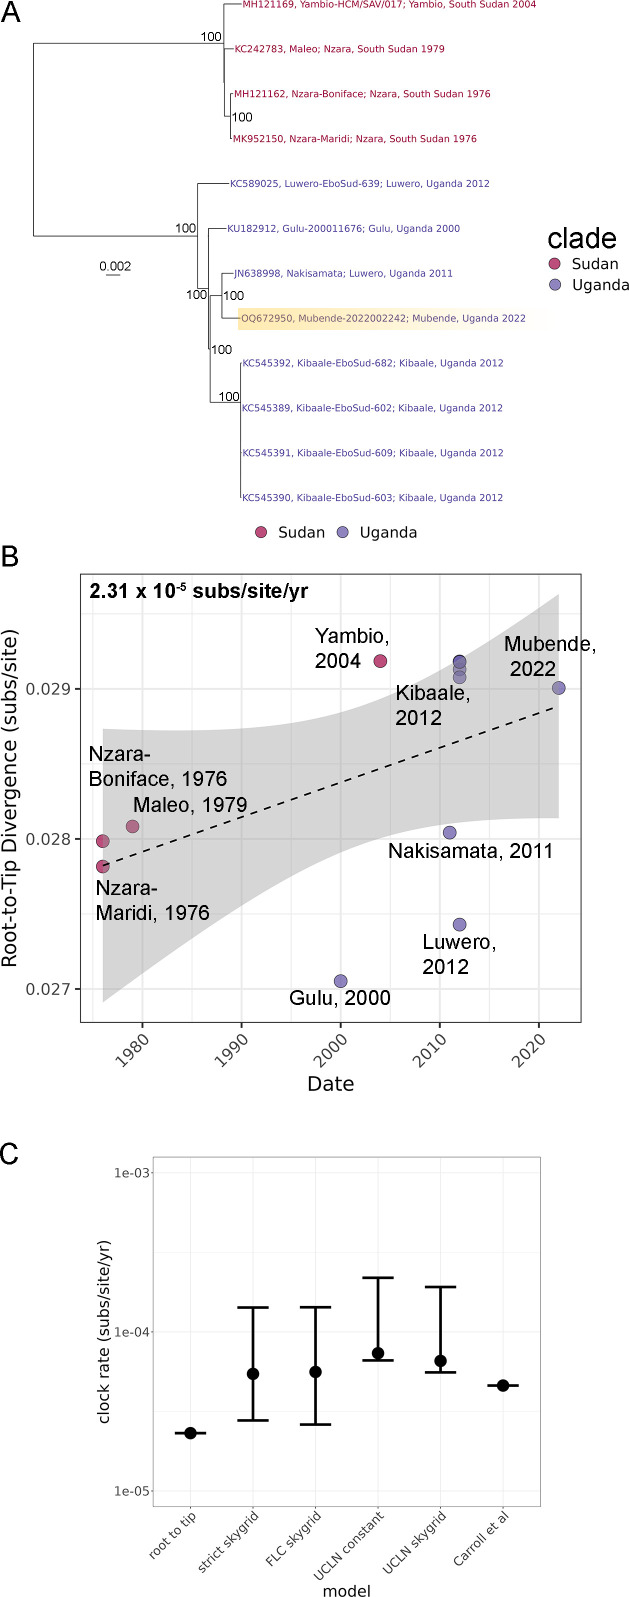
Fig 2.
Orthoebolavirus sudanense species inter-outbreak inferred evolutionary relationships. (A) Maximum likelihood phylogenetic tree for all available full-length SUDV sequences. The tree is midpoint rooted, and the outbreak locations (Sudan vs Uganda) are indicated by color. Bootstrap support values (gray) greater than 70% are indicated at nodes (n = 1,000 replicates). (B) Divergence from root vs time demonstrates the clock-like nature of the Orthoebolavirus sudanense species substitution rate (dotted line). The confidence interval is shaded gray. (C) Substitution rate estimates compared across different Bayesian models, the root-to-tip analysis from (B), and the historic analysis from Carroll et al.

