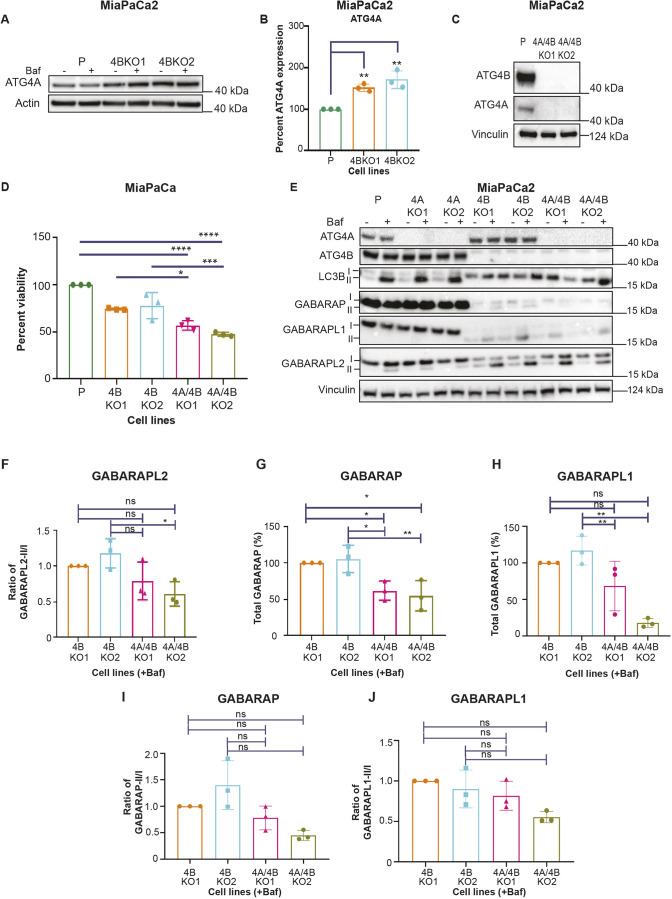
Fig. 4.
ATG4B KO lines have elevated ATG4A levels, and the combined loss of ATG4B and ATG4A further reduces viability as well as levels of GABARAP and GABARAPL1. (A) Representative immunoblot of ATG4A and actin (loading control) in MiaPaCa2 parental (P) and ATG4B KO lines with (+) and without (−) BafA1 (Baf) treatment (representative of n=3). (B) Bar graph showing quantification of ATG4A levels, from western blots as shown in A (percentage, normalized to the parental line), in samples from BafA1-treated MiaPaCa2 parental and ATG4B KO lines Mean±s.e.m. (n=3). **P<0.01 (ordinary one-way ANOVA with Dunnett's multiple comparisons tests). (C) Immunoblot representation of ATG4B, ATG4A and vinculin in parental and ATG4A/4B KO lines of MiaPaCa2 (representative of n=3). (D) Graphical representation of cell viability (%), determined using the Crystal Violet assay, of MiaPaCa2 parental, ATG4B KO and ATG4A/4B KO lines grown in 10% serum conditions for 72 h. Each sample was normalized to the parental line, but statistical significance was determined by comparing each ATG4A/4B KO line to the ATG4B KO line it was derived from (e.g. 4BKO1 versus 4A/4BKO1) or by comparing parental and ATG4A/4B KO lines. Mean±s.e.m. (n=3). *P<0.05; ***P<0.001; ****P<0.0001 (ordinary one-way ANOVA with Dunnett's multiple comparison tests). (E) Immunoblot of ATG4A, ATG4B, LC3B, GABARAP, GABARAPL1, GABARAPL2 and vinculin (loading control) in MiaPaCa2 parental, ATG4A KO, ATG4B KO and ATG4A/4B KO lines with (+) and without (−) BafA1 treatment (representative of n=3). Lipidated (II) and unlipidated (I) forms are indicated. (F–J) Bar graphs of (F) ratio of lipidated GABARAPL2 (GABARAPL2-II) to unlipidated GABARAPL2 (GABARAPL2-I), (G) total GABARAP (GABARAP-I and GABARAP-II), (H) total GABARAPL1 (GABARAPL1-II and GABARAPL1-I), (I) ratio of lipidated GABARAP (GABARAP-II) to unlipidated GABARAP (GABARAP-I), and (J) ratio of lipidated GABARAPL1 (GABARAPL1-II) to unlipidated GABARAPL1 (GABARAPL1-I), all in MiaPaCa2 ATG4B KO and ATG4A/4B KO lines with BafA1 treatment. Data are normalized to 4BKO1. Mean±s.e.m. (n=3). *P<0.05; **P<0.01; ns, not significant (ordinary one-way ANOVA with Dunnett's multiple comparisons tests).

