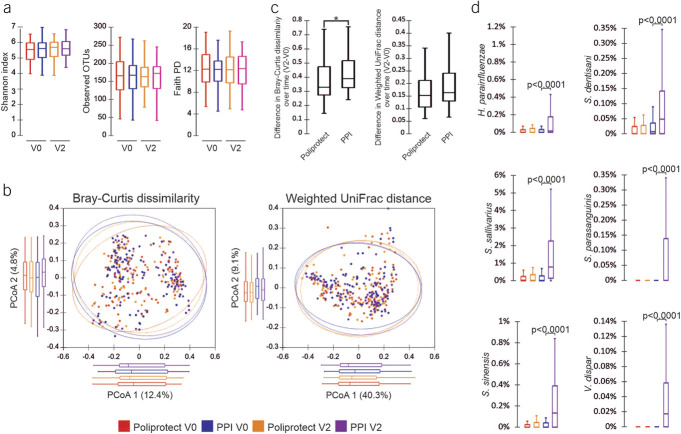
Figure 3.
Analysis of microbiome. (a) Color-coded box plots showing α-diversity estimators, measured for each group at different time points. (b) PCoA plot of bacterial β-diversity based on Bray-Curtis dissimilarity and weighted UniFrac distance according to individual health status. For each group, the 95% confidence interval has been drawn. Numbers between parentheses represent the percentage of the total variance explained by the principal coordinates. (c) Box plots showing the distribution of differences in the interindividual distances over time (V2–V0) for both considered beta measures. (d) Color-coded box plots showing the distribution of bacterial species that were significantly enriched at V2 with respect to V0. A P value ≤ 0.05 was considered statistically significant. PPI, proton-pump inhibitor.

