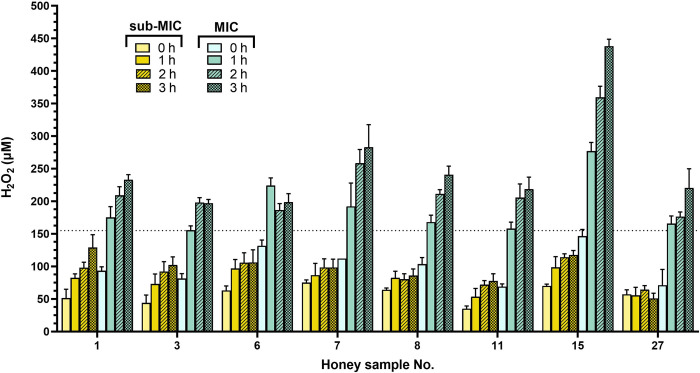
Fig 6. Generation of hydrogen peroxide (H2O2) in diluted honey samples during 3 hours of incubation.
The concentration of H2O2 was determined in honey samples No. 1, 3, 6, 7, 8, 11, 15 and 27 at their MIC and sub-MIC values of 6% and 3%, respectively. The data are expressed as mean concentration of H2O2.

