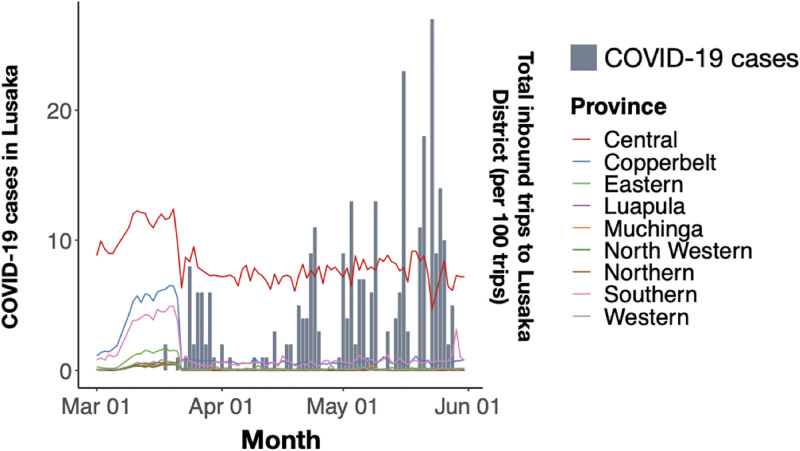
Fig 4. Mobility patterns during waves of COVID-19 cases at national and sub-national levels.
Total daily inbound trips to Lusaka District from other Provinces (excluding Lusaka Province) from 01 March 2020–01 June 2021. Grey bars represent daily COVID-19 cases in Lusaka district during Wave 1 (01 March 2020–31 May 2020).

