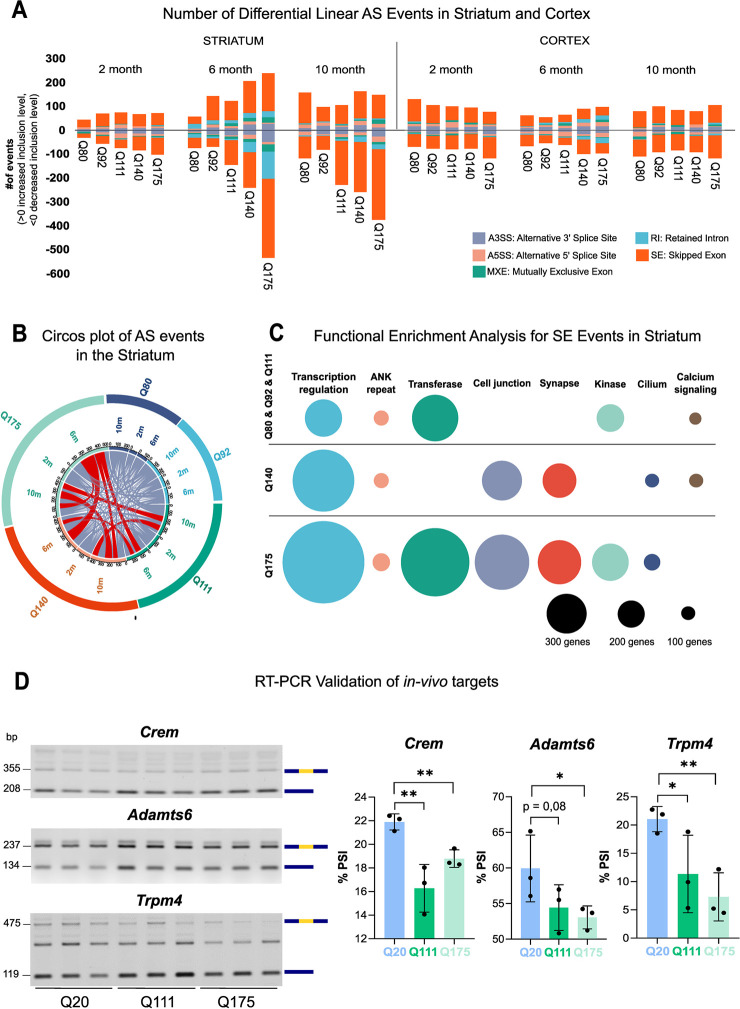
Fig 1. Aberrant linear alternative splicing in the striatum of KI animal models of HD.
A) Bar graphs show the number of differential AS events in the striatum and cortex from 6 mouse KI models (Q20, Q80, Q92, Q111, Q140 and Q175) of HD, presenting different Htt CAG repeat lengths and 3 ages (2, 6, and 10 months). The number of events is shown for each genotype, time point and brain region. The inclusion level is calculated in comparison to Q20 controls and the positive or negative values are plotted. Source data by Langfelder P. et al (2016) [28]. Further details can be found in the Methods section. Each color of the bar chart represents a different AS type. B) Circos plot represents the number of transcripts within the striatum—showing differential AS events—shared between different genotypes (Q80, Q92, Q111, Q140 and Q175) and time points (2, 6, and 10 months). Conditions (genotypes and/or time points) sharing more than 50 transcripts are depicted in red. C) Weighted nodes graphical representation shows the functional enrichment analysis for transcripts displaying significant skipped exon (SE) events in the striatum. Highly expanded Htt CAG sizes (Q140 and Q175), the major contributors to aberrant SE in the striatum, are shown separated. Nodes’ size legend is depicted at the bottom. D) Representative agarose gel images (left) and quantification plots (right) report the RT-PCR results of AS validation for Crem, Adamts6, and Trpm4, selected transcript targets. RT-PCR assay and quantification were performed on striata RNA from an independent set of wild-type (WT), Q20 and Q111/Q175 mice. Transcripts isoforms with inclusion or exclusion of the variable exon (in yellow) are visualized and quantified. The plots report the PSI, percent-spliced-in. *p-value < 0.05, **p-value < 0.01 (Student’s unpaired t-test; n = 3), error bars indicate standard deviation.

