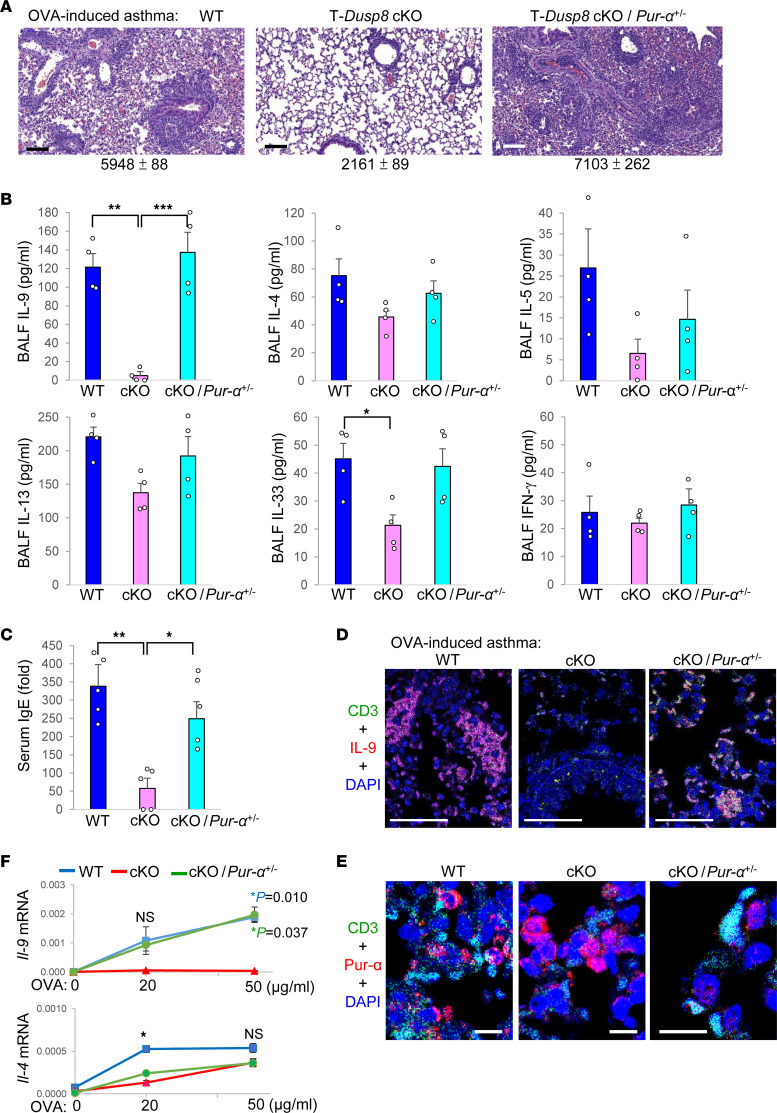
Figure 5. T cell–specific Dusp8 cKO mice are resistant to OVA-induced allergic asthma.
(A–F) Induction of OVA-induced asthma models in WT, T-Dusp8–cKO, or T-Dusp8 cKO/Pur-α heterozygous–KO (cKO/Pur-α+/–) mice. H&E-stained sections of the lung tissues from mice on day 26 of the OVA-induced asthma model (A). Mean ± SEM of infiltrating immune cells from 3 images are shown below. Scale bars: 250 μm. The cytokine levels in the BALFs of mice on day 26 of the OVA-induced asthma model were determined using ELISA assays (B). n = 4. The OVA-specific serum IgE levels of mice on day 26 were determined by ELISA assays (C). Data are presented relative to the basal levels from a WT mouse. n = 5. Confocal microscopy analyses of CD3 (green), IL-9 (red), and DAPI in the lung tissues from mice on day 26 of the OVA-induced asthma model (D). Scale bars: 50 μm. Confocal microscopy analyses of CD3 (green), Pur-α (red), and DAPI in the lung tissues from OVA-immunized mice (E). Scale bars: 10 μm. OVA-specific T cell–mediated cytokine production (F). T cells were isolated from the lymph nodes of OVA-immunized mice on day 21 after immunization, followed by in vitro stimulation with OVA for 72 hours. The mRNA levels of Il-9 and Il-4 were determined using real-time PCR and were normalized to Srp72 levels. n = 4 per group. WT (Dusp8fl/fl); T-Dusp8 cKO, T cell–specific Dusp8 cKO (Dusp8fl/fl;Cd4-Cre); cKO/Pur-α+/–, T-Dusp8 cKO/Pur-α heterozygous KO mice; OVA, ovalbumin. Mean ± SEM are shown. *P value < 0.05; **P value < 0.01; ***P value < 0.001 (1-way ANOVA and Tukey’s posthoc test). P value in blue, WT versus cKO; P value in green, cKO/Pur-α+/– versus cKO; NS, nonsignificant. Data shown are representative of 3 independent experiments.

