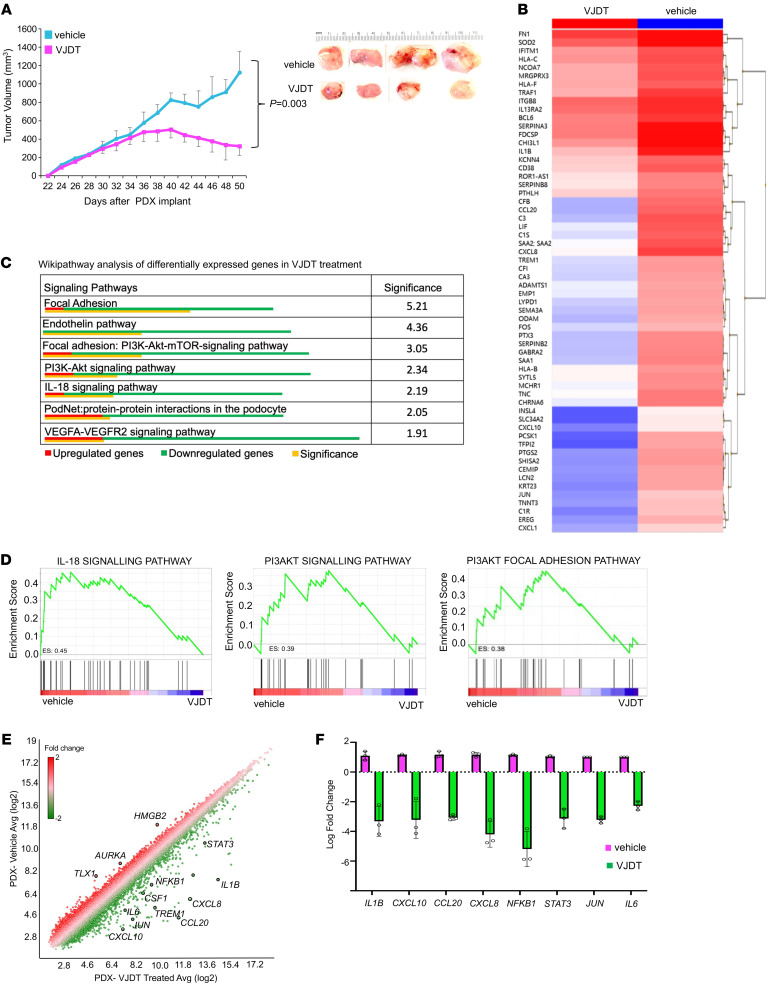
Figure 10. TREM1 inhibition by VJDT treatment restrains tumor growth in PDX models.
(A) Tumor growth curve of PDX melanoma xenograft in NSG mice receiving vehicle (DMSO) or VJDT (20 mg/kg) treatment every alternate day from 30 to 48 days (n = 4 mice/group, mean ± SEM). (B) Heatmap depicts hierarchical clustering of differentially expressed genes in PDX tumors between VJDT-treated versus vehicle. (C) Wikipathway analysis identify signaling pathways in PDX tumors significantly affected by VJDT treatment. (D) GSEA analysis showing downregulated signaling pathways during VJDT treatment. Enrichment score (ES) are shown. (E) Scatter plot depicts expression profile of specific genes of interest in VJDT-treated versus vehicle control. (F) Custom RT-qPCR confirmation of expression profile for key genes altered by VJDT treatment. Data from 3 independent experiments performed in triplicate (mean ± SD shown). P value calculated by 2-way ANOVA with Tukey’s correction t test for multiple comparison of longitudinal tumor growth between various groups (A [tumor growth]) or using 2-sided Fisher’s exact t test in pathway analysis (C).

