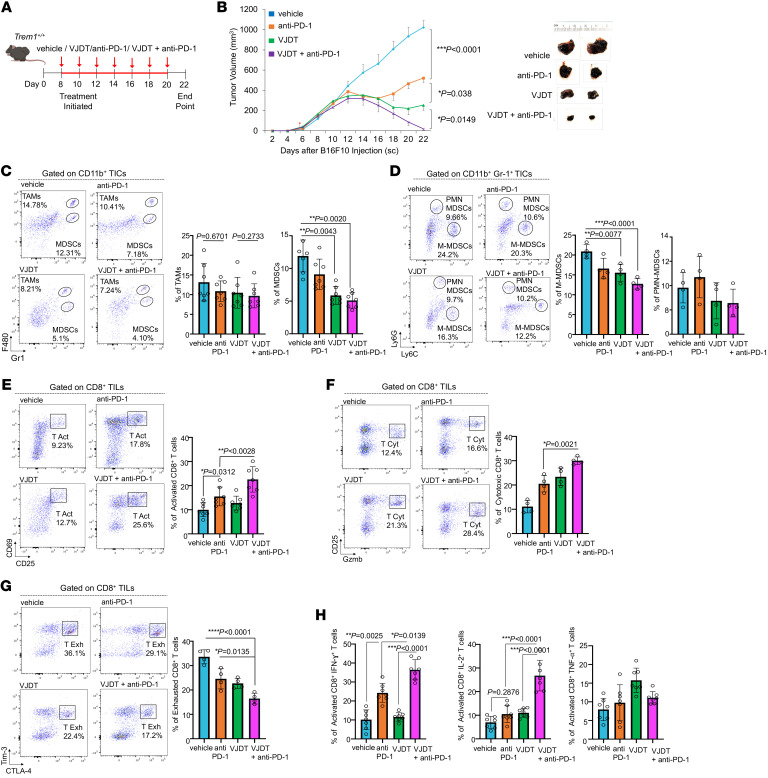
Figure 5. TREM1 inhibition enhances anti-PD-1 response by attenuating MDSC frequency and augments CD8+T cell immunity.
(A) Schematic illustrates various treatment regimens on B16F10 tumors in Trem1+/+ mice. Melanoma-bearing Trem1+/+ mice were treated with either vehicle (combination of DMSO and IgG2a Isotype) or 200 μg anti-PD-1 antibody or 20 mg/kg VJDT or a combination of both from day 8 until day 20, on every alternate day of tumor progression. (B) Tumor growth curves expressed as overall tumor volume monitored every alternate day (n = 7 mice/group, mean ± SEM). Representative microscopic images of tumors from the indicated groups on day 22 are shown. (C–H) Tumors were harvested on day 22. Flow cytometry analysis of gated immune subset cells are shown (plots depict 1 representative experiment performed in triplicate, n = 4–7mice/group, mean ± SD). (C) Frequency of CD11b+F4/80+Gr-1– TAMs, CD11b+F4/80–Gr-1+ MDSCs, and (D) CD11b+Gr-1+Ly6ChiLy6G– M-MDSCs and CD11b+ Gr1+Ly6CloLy6G+ PMN-MDSCs in the TME of the indicated groups. (E) Frequency of activated CD8+CD69+CD25+ T cells, (F) cytotoxic CD8+GzmB+CD25+ T cells, and (G) exhausted CD8+Tim-3+CTLA-4+ T cells within the TME. (H) Frequency of tumor-infiltrating CD8+CD25+ T cells expressing either IFN-γ, IL-2, or TNF-α. **P < 0.01; ***P < 0.001; ****P < 0.0001 by 2-way ANOVA for multiple comparison of longitudinal tumor growth between groups (B [tumor growth]) or 2-tailed Student’s t test for comparison between 2 groups (C–H).

