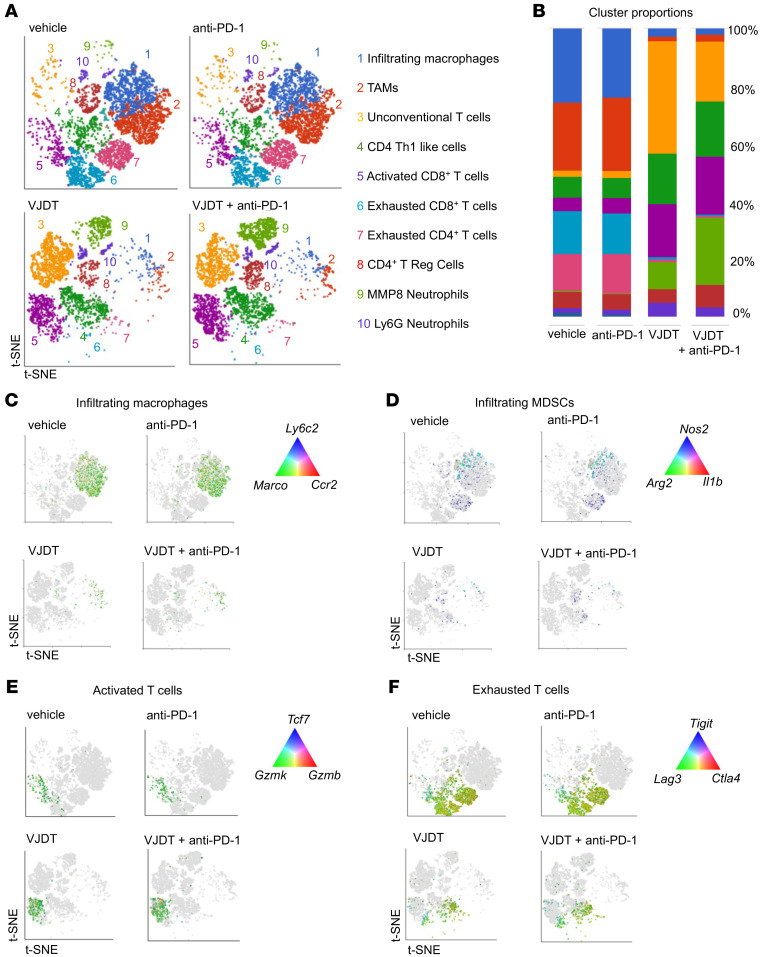
Figure 6. scRNA-Seq analysis reveals alterations of TICs in TREM1 inhibition with anti-PD-1 treatment of B16F10 melanoma.
scRNA-Seq of tumor-infiltrating CD45+ immune cells sorted from TME of B16F10 melanoma-bearing Trem1+/+ mice receiving either VJDT, anti-PD-1, both in combinational treatment, or vehicle. For each experimental group, 3 biological replicates were pooled. (A) scRNA-Seq data analyzed using Partek Flow to generate t-SNE plot showing differential cell clusters and their frequencies within the TME. Cluster identities were annotated based on expression of key gene signatures as described in Methods. (B) Bar graph depicts cluster proportions associated with each treatment group. (C–F) t-SNE plots characterize changes during treatment in the expression profile of key genes involved in (C) infiltrating macrophages, (D) infiltrating MDSCs, (E) activated T cells, and (F) exhausted T cells across the indicated groups.

