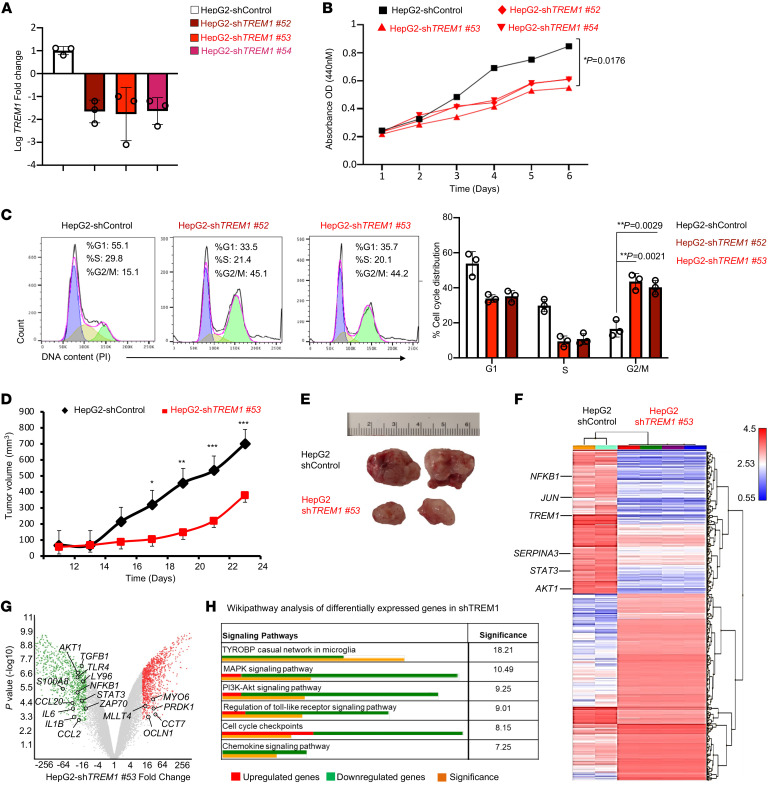
Figure 8. TREM1 silencing in HepG2 cells inhibits cell proliferation, migration, and tumor growth in xenograft model.
(A) RT-qPCR confirmation of TREM1 knockdown in HepG2 cells following transfection with shTREM1 clones nos. 52, 53, and 54 in comparison to shControl-scrambled vector. Data represent 3 independent experiments performed in triplicate (n = 3/group, mean ± SD). (B) Line graph shows WST-1 assay to assess cell proliferation in TREM1 knockdown HepG2 clones (shTREM1 nos. 52, 53, and 54) and its shControl clone for 6 days (n = 3/group, mean ± SD). (C) Flow cytometry histogram plots depict cell cycle progression of TREM1 knockdown HepG2 clones (shTREM1 nos. 52 and 53) and shControl over 24 hours. Representative plot from 3 independent experiments performed in triplicate (mean ± SD shown). (D) Tumor growth curves for TREM1 knockdown shTREM1 clone no. 53 in NSG mice and its shControl described as overall tumor volume measured every alternate day (n = 8 mice/group, mean ± SEM). (E) Representative microscopic images of tumors from the indicated groups at day 23. (F) Transcriptomic analysis by Clariom S Microarray used to plot heatmap depicting hierarchical clustering of differentially expressed genes between shTREM1 no. 53 knockdown tumors (n = 4) and the shControl HepG2 tumors (n = 2). (G) Volcano plots depict differentially expressed genes of the shTREM1 no. 53 knockdown tumors compared with shControl HepG2 tumors. Red dots represent upregulated genes with fold change greater than 10 and P < 0.001, green dots show downregulated genes. (H) Wikipathway analysis depicts significantly affected pathways in TREM1 knockdown HepG2 clone in comparison to control. *P < 0.05; **P < 0.01; ***P < 0.001 by 2-way ANOVA with Tukey’s correction t test for comparing cell proliferation (B), by 2-tailed Student’s t test for comparison between 2 groups (C), 2-way ANOVA for multiple comparison of longitudinal tumor growth between various groups (D [tumor growth]), or using 2-sided Fisher’s exact t test in pathway analysis (H).

