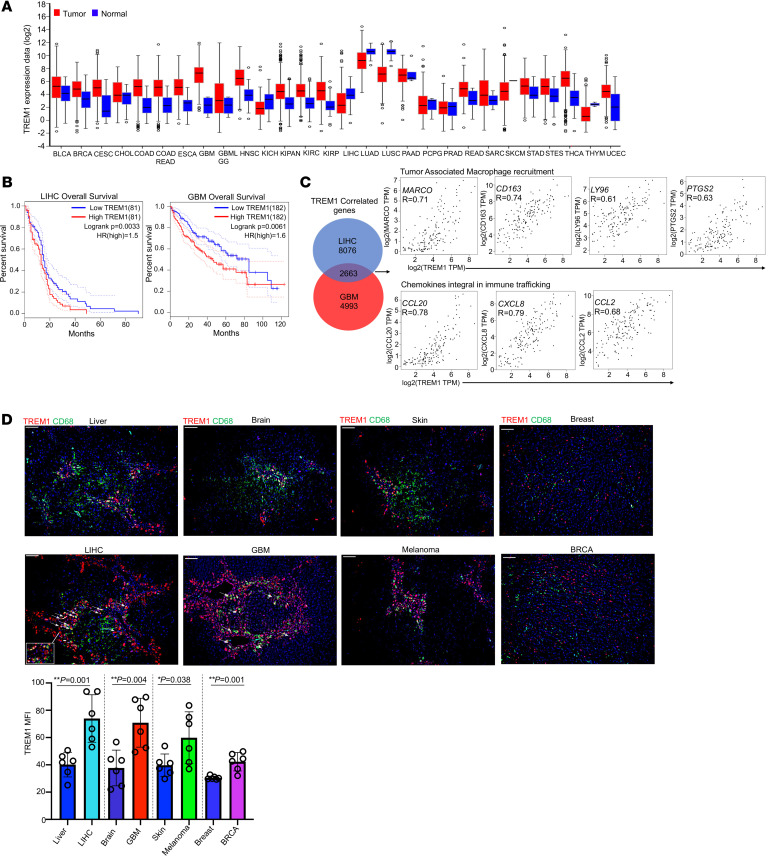
Figure 9. TREM1 expression is associated with poor prognosis in selected human tumors.
(A) TREM1 mRNA expression between 28 human neoplastic and corresponding nonneoplastic tissues. (B) Kaplan-Meier survival curves describe correlation between TREM1 expression and overall patient survival in LIHC (n = 162) and GBM (n = 364) cohorts. (C) Venn diagram showing TREM1-correlating genes in LIHC and GBM cohorts. Correlation data for TREM1 expression (X axis) and the indicated genes (Y axis) for LIHC cohort. (D) Fluorescent multiplex IHC images of human samples from people in the control group and people diagnosed with primary carcinomas in liver, brain, skin, and breast. Original magnification, ×10; scale bar: 100μm. TREM1 (red), DAPI (blue), and CD68 (green). Quantification of overall TREM1 expression as MFI in different zones of tumor and control tissues (n = 6 zones per tissue section). *P < 0.05; **P < 0.01 by 2-tailed Student’s t test for comparison between 2 groups.

